It isn't in the IRS code.
It doesn't appear on a statement.
And no one sends you a bill.
Yet over a lifetime, this cost can reach six figures for many households.
We'll call it Retirement Drag.
What Is Retirement Drag?
Retirement Drag is the cumulative loss of future retirement income caused by unexamined assumptions and delayed decisions.
It builds slowly through three forces:
- Policy Drag — uncertainty around future benefit programs
- Inflation Drag — mismatches between income adjustments and real expenses
- Timing Drag — the cost of postponing key planning decisions
Each force seems manageable on its own. Combined, they quietly compound.
The result is rarely a sudden failure — it's a gradual loss of flexibility, confidence, and spending power later in life.
Why This Matters Even If You're Far From Retirement
If you're in your 30s, 40s, or early 50s, retirement may feel distant.
But here's the counterintuitive truth:
The earlier you are in your career, the more exposed you are to Retirement Drag.
Time doesn't just compound investment returns.
It compounds assumptions that go unchallenged.
How Policy Risk Could Reduce Your Social Security
Social Security is often modeled as a stable, inflation-adjusted income stream.
Under current law, that stability is not guaranteed.
The structural reality
Social Security is funded primarily by payroll taxes. When benefits exceed incoming revenue, the system draws from its trust funds. Once those reserves are depleted, benefits can only be paid from current tax receipts.
According to the Social Security Trustees, scheduled benefits exceed dedicated funding beginning in the early 2030s, after which benefits would need to be reduced to match revenue if no legislative changes occur.¹
This isn't a prediction of collapse — it's the program's default operating mechanism under current law.
Why this creates Retirement Drag
For retirees already collecting benefits, a reduction is painful but time-limited.
For workers years away from retirement:
- More years are exposed to reduced benefits
- The cumulative loss is larger
- Personal assets must make up the difference
A smaller benefit paid over many years can cost more than a large one paid briefly.2
Figure 1: Projected Social Security income for a hypothetical married couple retiring at age 67 with $48,000 in scheduled annual benefits. The step-change risk affects workers with more years exposed to reduced benefits.
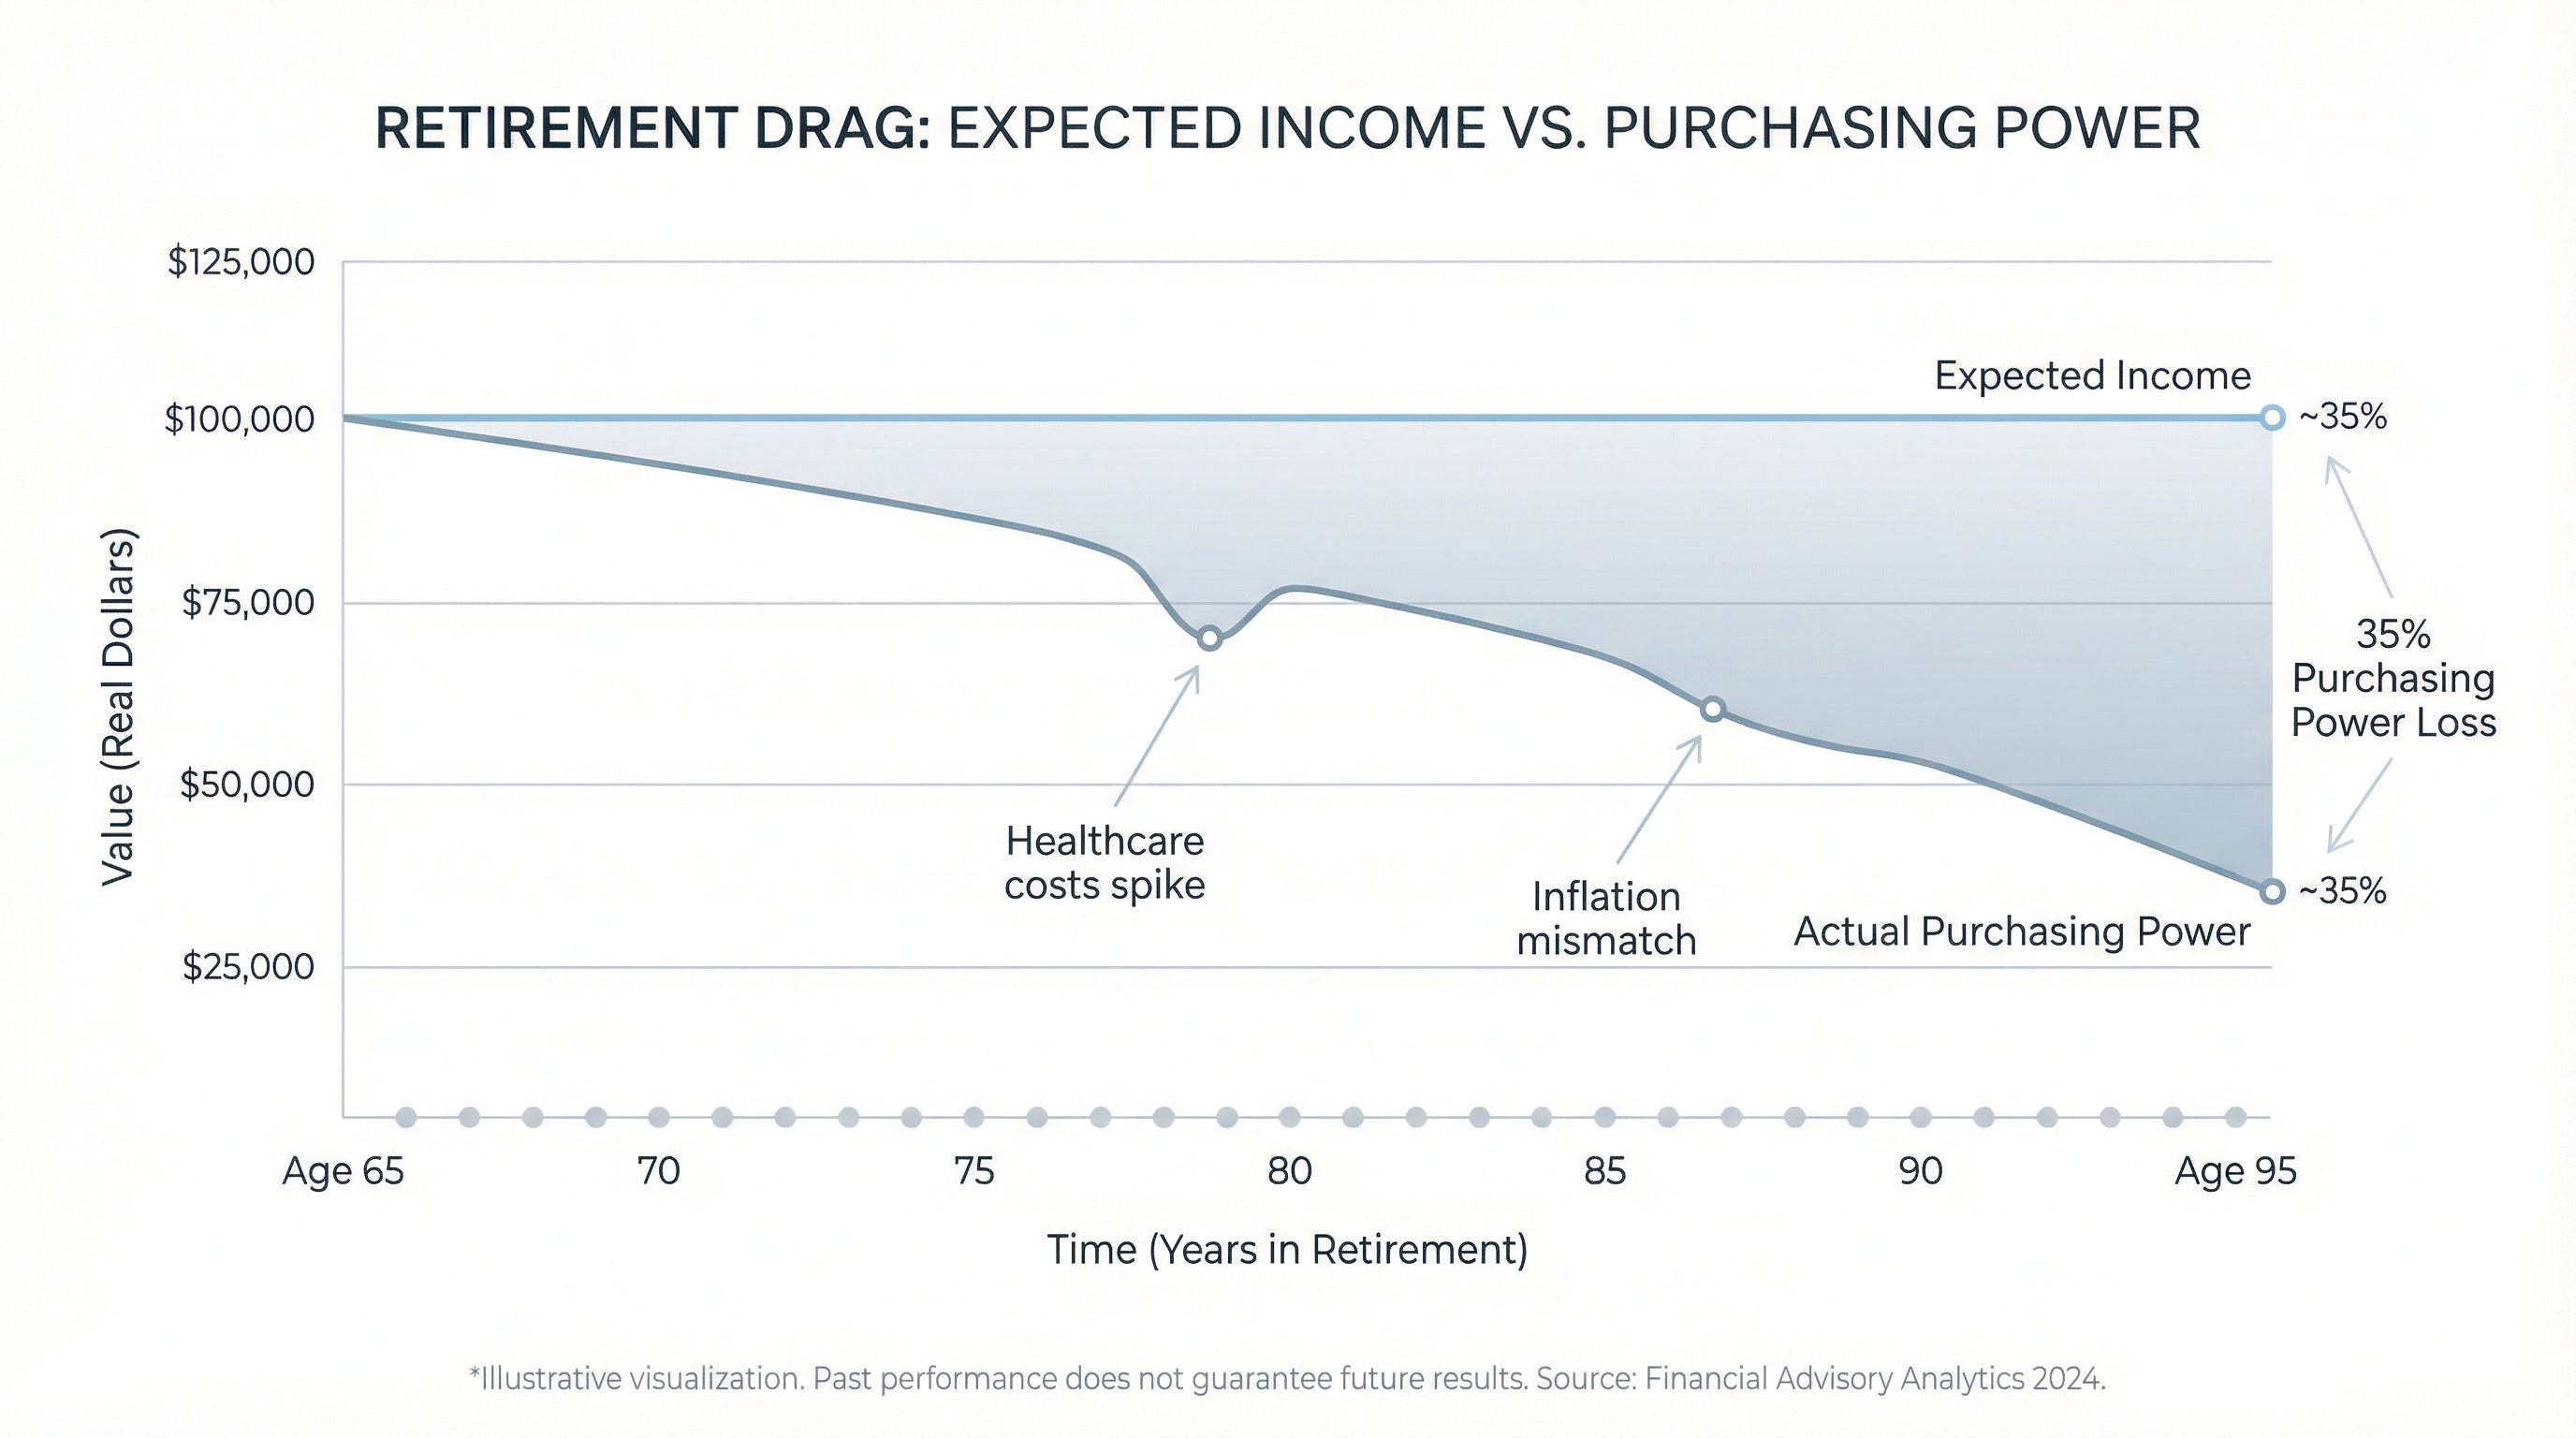
Inflation Drag: The Hidden Erosion of Purchasing Power
Most retirement projections assume one inflation rate applies evenly to everything.
Reality is more uneven.
The mismatch
Social Security benefits are adjusted using a broad consumer inflation index.
Retiree spending is often concentrated in categories that inflate faster:
- Healthcare
- Housing
- Insurance
- Services
Even a modest mismatch — for example, 2.5% income inflation vs 4% expense inflation — compounds significantly over a 25- to 30-year retirement.4
Why this matters early
When income and expense inflation are treated as equal:
- Spending looks "covered" on paper
- Gaps appear late, when adjustments are harder
- The shortfall feels like a surprise rather than a structural issue
Inflation Drag rarely feels dramatic in any single year. Its power comes from persistence.
Timing Drag: The Cost of Delaying Key Decisions
Many retirement decisions feel reversible.
Economically, they often aren't.
Examples include:
- Delaying analysis of Social Security claiming strategies
- Postponing portfolio structure adjustments
- Waiting to stress-test downside scenarios
The misconception
"I'll optimize later."
In practice, optimization delayed is optimization diluted.
As time passes:
- Fewer levers remain
- Required changes become larger
- Flexibility declines as uncertainty increases
Timing Drag is dangerous precisely because it doesn't feel like a mistake while it's happening.6
Quantifying the cost
For Alex and Jordan, the cost of delaying retirement planning optimization can be measured directly.
At age 55, they're 5 years past the optimal age (50) to begin Social Security claiming analysis, tax planning, and withdrawal strategy optimization. That 5-year delay has a compounding effect.
Timing Drag Calculation:
- Portfolio at age 55: $900,000
- Optimization benefit: 1% per year (from better decisions)
- Years of delay: 5
- Portfolio loss by retirement: ~$46,000
This $46,000 represents the foregone growth from decisions that could have been optimized earlier—but weren't.
Cost of 5-Year Planning Delay
$-168,512
Portfolio value lost by age 67
Figure: By delaying retirement planning optimization by 5 years (from age 50 to 55), Alex and Jordan's portfolio loses $-168,512 in value by retirement. This assumes a 1% annual optimization benefit from earlier Social Security analysis, tax planning, and withdrawal strategies.
A Quantitative Example: Retirement Drag in Action
Meet Alex and Jordan
To illustrate how Retirement Drag works, consider a hypothetical married couple:
Demographics
- Current age: 55
- Retirement age: 67
- Life expectancy: 92
- Born: 1971
Income
- SS at age 67: $48,000/year3
- SS COLA: 2.5%
- SS cut year: 2033 (age 78)
- Cut amount: 23% reduction
Portfolio & Expenses
- Portfolio: $900,000
- Return: 6.5%/year8
- Expenses: $60,000/year
- Expense inflation: 4.0%
These figures are illustrative and not personalized. All calculations shown below use these explicit assumptions.
On the surface, Alex and Jordan's plan appears reasonable.
What changes under a Retirement Drag stress test?
- Social Security benefits are reduced under current-law assumptions later in retirement
- Living expenses grow faster than income
- Portfolio withdrawals increase to cover the gap
Each adjustment is modest in isolation. Together, they materially change outcomes.
Calculation Assumptions:
Total Additional Portfolio Withdrawals Required
$1,327,712
Ages 67-92 (25 years)
Figure: The gap between inflation-adjusted expenses ($60K growing at 4%) and Social Security income ($48K growing at 2.5%, then cut 23% at age 78) requires $1,327,712 in additional portfolio withdrawals over Alex and Jordan's retirement. This accelerates portfolio depletion and increases longevity risk.
Figure 3: At age 80, Retirement Drag forces Alex and Jordan to withdraw significantly more from their portfolio to compensate for reduced Social Security benefits. Total income remains similar, but asset depletion accelerates.
Figure 4: Higher withdrawals earlier in retirement increase longevity risk. Alex and Jordan's portfolio depletes years before their planned life expectancy under the Retirement Drag scenario.
Why Younger Workers Are Often More Exposed
It's natural to assume policy risk matters most near retirement.
In reality, younger and mid-career workers often face greater exposure:
- More years affected by policy outcomes
- Greater reliance on future benefits
- More assumptions embedded in projections
Older retirees face uncertainty over a shorter horizon.
Younger workers face it over a longer one.
Time amplifies both good decisions and blind spots.7
This Isn't Fear-Based Planning
Retirement Drag doesn't imply:
- Social Security will disappear
- Inflation will spiral uncontrollably
- Retirement planning is futile
It highlights why single-path projections are fragile.
Resilient planning doesn't assume the worst.
It prepares for multiple plausible futures.
One Plan, Multiple Futures
A strong retirement plan should answer:
- What if benefits are reduced?
- What if inflation is uneven?
- What if markets disappoint early?
When these scenarios are modeled early:
- Adjustments are smaller
- Tradeoffs are clearer
- Options are broader
When they're modeled late:
- Choices narrow
- Risk concentrates
- Flexibility disappears
Bringing It Back to You
You don't need to overhaul your life to reduce Retirement Drag.
But you do need to measure it.
Until you model:
- Policy stress
- Inflation mismatches
- Timing sensitivity
you're planning with blind spots — even if your savings rate is strong.
Calculate Your Retirement Drag Impact
See how Policy Drag, Inflation Drag, and Combined Drag affect your specific retirement plan.
Compare all four scenarios side-by-side using your own data — portfolio balance projections from today through age 95.
References
- Social Security Administration, Trustees Report — Trust fund depletion and payable benefits
- Congressional Budget Office, Social Security Analysis
- Social Security Administration, SSA Press Office — Average benefit data and annual fact sheets (published each fall)
- Pension Research Council, Pension Research and Analysis
- Kaiser Family Foundation, Health Costs Research, 2025
- Kitces, Michael, Nerd's Eye View - Financial Planning Research
- AARP, Economics Research
- Vanguard, Investor Resources
- Bengen, W. (1994), Determining Withdrawal Rates Using Historical Data