📝 Content Notice: This guide was created with AI-assisted technology and reviewed by Praxion Finance LLC. Praxion is an educational tool, not financial advice — please verify important decisions with a qualified professional.
1. Getting Started & Quick Start
Create Your Free Account
Signing up takes less than a minute — no credit card required.
- Click "Sign Up" or "Try as guest" from the homepage (Google sign-in is also supported).
- Enter your email and create a secure password, or continue with Google.
- Verify your email if prompted (check your spam folder if needed).
- You are taken to Quick Start to build your first plan.
Quick Start: A Working Plan in Minutes
Quick Start is a short, guided set of questions (typically 13–16, depending on your situation) that produces a complete, projectable plan right away. You answer questions such as:
- Your age and marital status, work profile, and state of residence
- Whether you are still working or already retired, and your target retirement age
- Annual income, monthly expenses, and total savings (with an optional account breakdown)
- Social Security expectations and your desired retirement income
- Risk tolerance, what matters most to you, and how hands-on you want plan updates to be
When you submit, Praxion creates your profile, runs an initial simulation (Roth and withdrawal strategy, full projection, Financial Health score, and Monte Carlo), and then lands you on your Dashboard in Guided mode.
2. Building & Refining Your Profile
Your profile is your complete retirement plan — all of your accounts, income, expenses, goals, and assumptions. After Quick Start, add detail anytime in Edit Profile.
What it is: The full editor for everything in your plan.
Where to find it: Left sidebar → Edit Profile (route /onboardingv2), or the Profile Summary on the dashboard.
How to use it: Open any card to edit that topic, then click Done to save. You do not have to fill everything at once.
The Edit Profile Card Dashboard
Edit Profile is a card dashboard — not a long linear wizard. There are 16 cards organized into 6 sections. Tap a card to open a focused editor for that topic:
- Personal & household (ages, marital status, state)
- Work income (salary, growth, spouse)
- Monthly spending
- Debts & liabilities
- Housing & mortgage
- Healthcare & insurance
- Rental property income
- Retirement accounts (401k, IRA, Roth, HSA)
- Taxable investments & cash
- Retirement goals & Social Security
- Pension income
- Risk tolerance & goals
- Investment preferences
- Growth rates
- Tax & withdrawal strategy
- Life events
📸 Edit Profile: entering a 401(k) balance and contribution rate
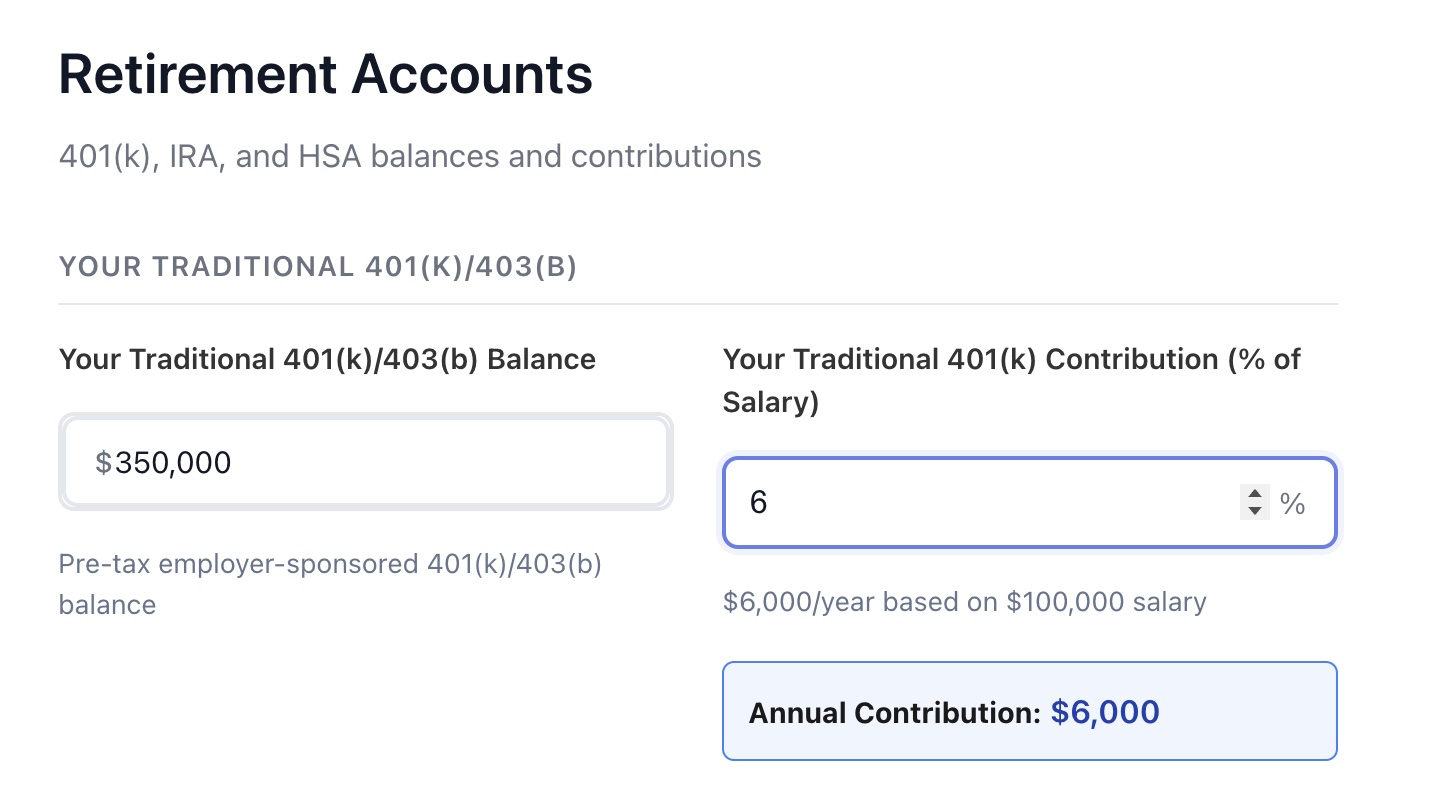
Example: $350,000 balance with a 6% contribution (about $6,000/year on a $100,000 salary)
Profile Completeness
A completeness percentage (shown in the header) tracks how much of your profile is filled in. Higher completeness means more accurate projections — and it unlocks more of the app.
Life Events
A life event is any future income or expense that is not already captured by your standard profile fields — an inheritance, a home renovation, a new car, college tuition, a business sale, or a sabbatical. Life events are optional, but adding them makes your projection noticeably more realistic.
What it is: One-time, recurring, or permanent income/expense items placed on your plan timeline.
Where to find it: Edit Profile → Strategy & Assumptions → Life events card. You can also add one inline from any year of the Financial Journey table, or sweep one in Scenario Studio.
How to use it: Click Add Life Event, then describe it and set the details below. Use Edit, Clone, or Delete to manage the list.
What you set for each event
- Name — a short description (an icon is chosen automatically from keywords)
- Category — Income or Expense
- Type — One-time, Recurring (with a duration in years/months), or Permanent
- Start age — when it begins (defaults to your current age)
- Amount — a one-time total, or an annual amount for recurring/permanent items
- Annual growth/decline rate — to inflate or taper the amount over time (for example, rising tuition)
- Tax treatment (income only) — Tax-free (e.g. gift or inheritance), Ordinary income, or Capital gains
- Notes — optional context for your future self
- Divorce: alimony or child support as recurring income/expense (with a duration), plus legal fees as a one-time expense
- New child: childcare and child-related costs as recurring expenses, then college tuition as a 4-year recurring expense starting at the child's age 18
- Disability or career change: adjust income at the transition age, plus any insurance payments
- Relocation or a new business: moving/startup costs as expenses, plus any income changes
3. Your Dashboard (Modes & Hero)
The Dashboard is your home base. It adapts to how complete your plan is and how much depth you want.
Three Dashboard Modes
You can switch modes from the toggle in the dashboard header:
The Plan Health Command Center (Overview)
The Overview hero brings your most important signals together in one place:
- Financial Health — a 0–100 score with a tier (At risk / Fair / Good) and a breakdown across Cash Flow, Withdrawal, Tax Efficiency, Longevity, and Market Risk.
- Net worth — your headline value with a trajectory sparkline.
- Years to retirement and an on-track / needs-attention status.
- Retirement goal — the total savings needed for your target lifestyle.
- Plan of Record — a plan-success ring backed by the Confidence Grid, with Monte Carlo as corroboration.
- Data Health gauge — a quick read that links to the Data Health tab.
- Needs Attention rail and a personalized Intelligence Feed of insights.
- Run AI Scenario Analysis — kicks off an AI Review (see section 8).
📸 Dashboard: the Plan Health Command Center at a glance
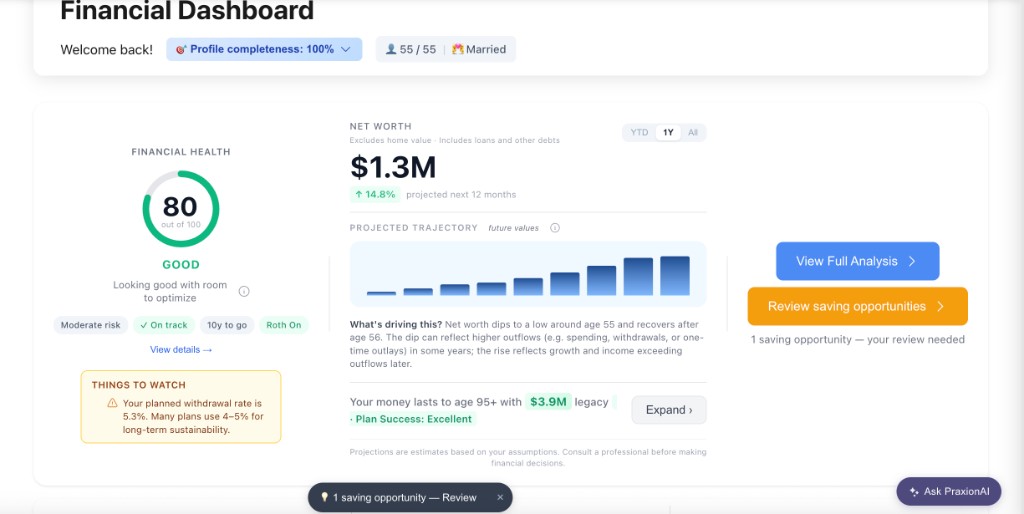
Example: Sarah & Mike, age 55 married, $1.3M net worth, 80 Financial Health, 10 years to retirement
4. The Dashboard Tabs
In Power mode the dashboard shows eight tabs (Standard mode shows the first three plus My Plan). Some tabs unlock at 100% completeness, and the premium tabs prompt guests to sign up.
1. Overview (always available)
The Plan Health Command Center, Needs Attention rail, Intelligence Feed, and quick What-If templates.
2. Scenarios (always available)
Your withdrawal-strategy summary, total optimization opportunity, decision cards, your Roth conversion schedule, and quick scenario templates.
3. Analysis (Power mode)
Monte Carlo summary, cash-flow summary, the stress boundary ("Cliff's Edge"), AI insights, and tax-cliff / Social Security taxation / future-tax-risk cards.
4. Projections (Power mode)
Lifetime projection cards (earliest retirement age, total retirement spending, lifetime taxes, RMD impact) with linked charts and tables.
5. My Plan (unlocks at 100%)
Your phase-by-phase income vs expenses, a Strategic Blueprint, and an execution sidebar. The tab is visible earlier but the full year-by-year detail unlocks at 100% completeness.
6. Income Planner (Power mode; sign-in required)
A full income-planning workspace with sub-tabs — Inputs, Buckets, Waterfall, Strategies, Stress, Sequence, and Monitor. Move live sliders to test ideas without changing your saved profile.
7. Data Health (Power mode; sign-in required)
A Data Health score, balance reconciliation, deterministic plan-health signals, a shock simulation (−5% / −10% / −20%), AI nudges, and a pulse ledger. See section 8.
8. AI Optimizer (unlocks at 100%; sign-in required)
Compares your live portfolio against your plan, simulates market drops, and runs an AI generator/critic to suggest changes you can apply or revert — with a change history and one-click revert. See section 8.
5. Financial Journey (Year-by-Year)
The Financial Journey is the detailed year-by-year projection from today through the end of your plan.
What it is: A full year-by-year table of income, contributions, balances, taxes, withdrawals, and healthcare.
Where to find it: Left sidebar → Financial Journey (route /projection-details).
How to use it: Scroll the years, hover columns for breakdowns, open the Financial Order of Operations on any row, and edit cells to test changes.
What You See Each Year
- Core: Year, Age, Phase (Working / Retired)
- Income: Salary, bonus, RSUs, Social Security, pension, rental, dividends, interest
- Contributions: 401(k), IRA, Roth, HSA with catch-up tracking
- Balances: Traditional & Roth 401(k), Traditional & Roth IRA, HSA, brokerage, cash
- Taxes: Federal, state, FICA, Medicare, capital gains, effective rate
- Withdrawals: By account, RMDs, and Roth conversions
- Healthcare: Premiums, IRMAA surcharges, out-of-pocket
Financial Order of Operations (FOP)
Click the clipboard icon on any row to open the Financial Order of Operations — a deep breakdown of how money flows that year, including:
- 💰 Cash flow: all income sources and how expenses are covered
- 📊 Tax strategy: federal bracket, effective rate, total taxes, and opportunities
- 🏛️ Social Security taxation: whether benefits are taxed at 0%, 50%, or 85%, and how to reduce it
- 🔄 Roth conversions: amounts, tax cost, and funding sources
- 📋 RMD details: distributions by account and QCD opportunities
- ⚠️ Sequence-of-returns risk: alerts for the critical first five retirement years
📸 Financial Order of Operations: a detailed year breakdown
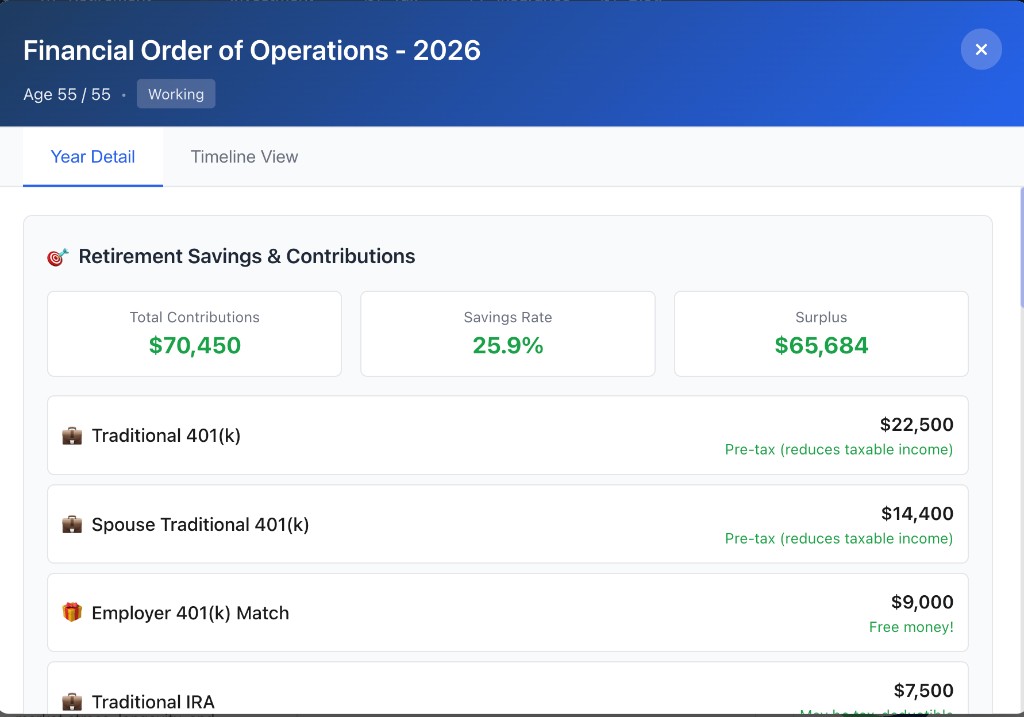
Example: FOP 2026 — Age 55/55 Working, $70,450 contributions, 25.9% savings rate, $65,684 surplus
Editable Cells
Many cells are editable — click to override a value and see the effect ripple through your plan:
- Expenses (personal, healthcare)
- Contribution amounts
- Roth conversion amounts
- Account balances
6. Action Plan & Analysis
The Action Plan turns your projection into prioritized, personalized analysis organized by retirement phase.
What it is: A roadmap of prioritized recommendations and insights based on your modeled plan.
Where to find it: Left sidebar → Action Plan & Analysis (route /action-plan).
How to use it: Work top-down by priority; open an item to see the rationale, impact, and steps.
Retirement Phases
- Working Years: now until retirement — maximize savings and tax efficiency
- Early Retirement (Phase 1): retirement to age 70 — bridge the gap before Social Security; prime Roth conversion years
- RMD Phase (Phase 2): roughly age 70–85 — manage Required Minimum Distributions and taxes
- Late Retirement (Phase 3): age 85+ — preserve wealth and focus on healthcare and longevity
- Survivor Planning: for married couples — spouse protection strategies
Analysis Types
- 💰 Savings optimization: 401(k), IRA, and catch-up contributions
- 📊 Tax strategy: Roth conversions, bracket management, tax-loss harvesting
- 🏛️ Social Security: optimal claiming age and spousal strategies
- 💸 Withdrawal strategy: account sequencing and RMD management
- 🏥 Healthcare: Medicare planning, HSA optimization, IRMAA avoidance
📸 Action Plan: prioritized analysis by retirement phase
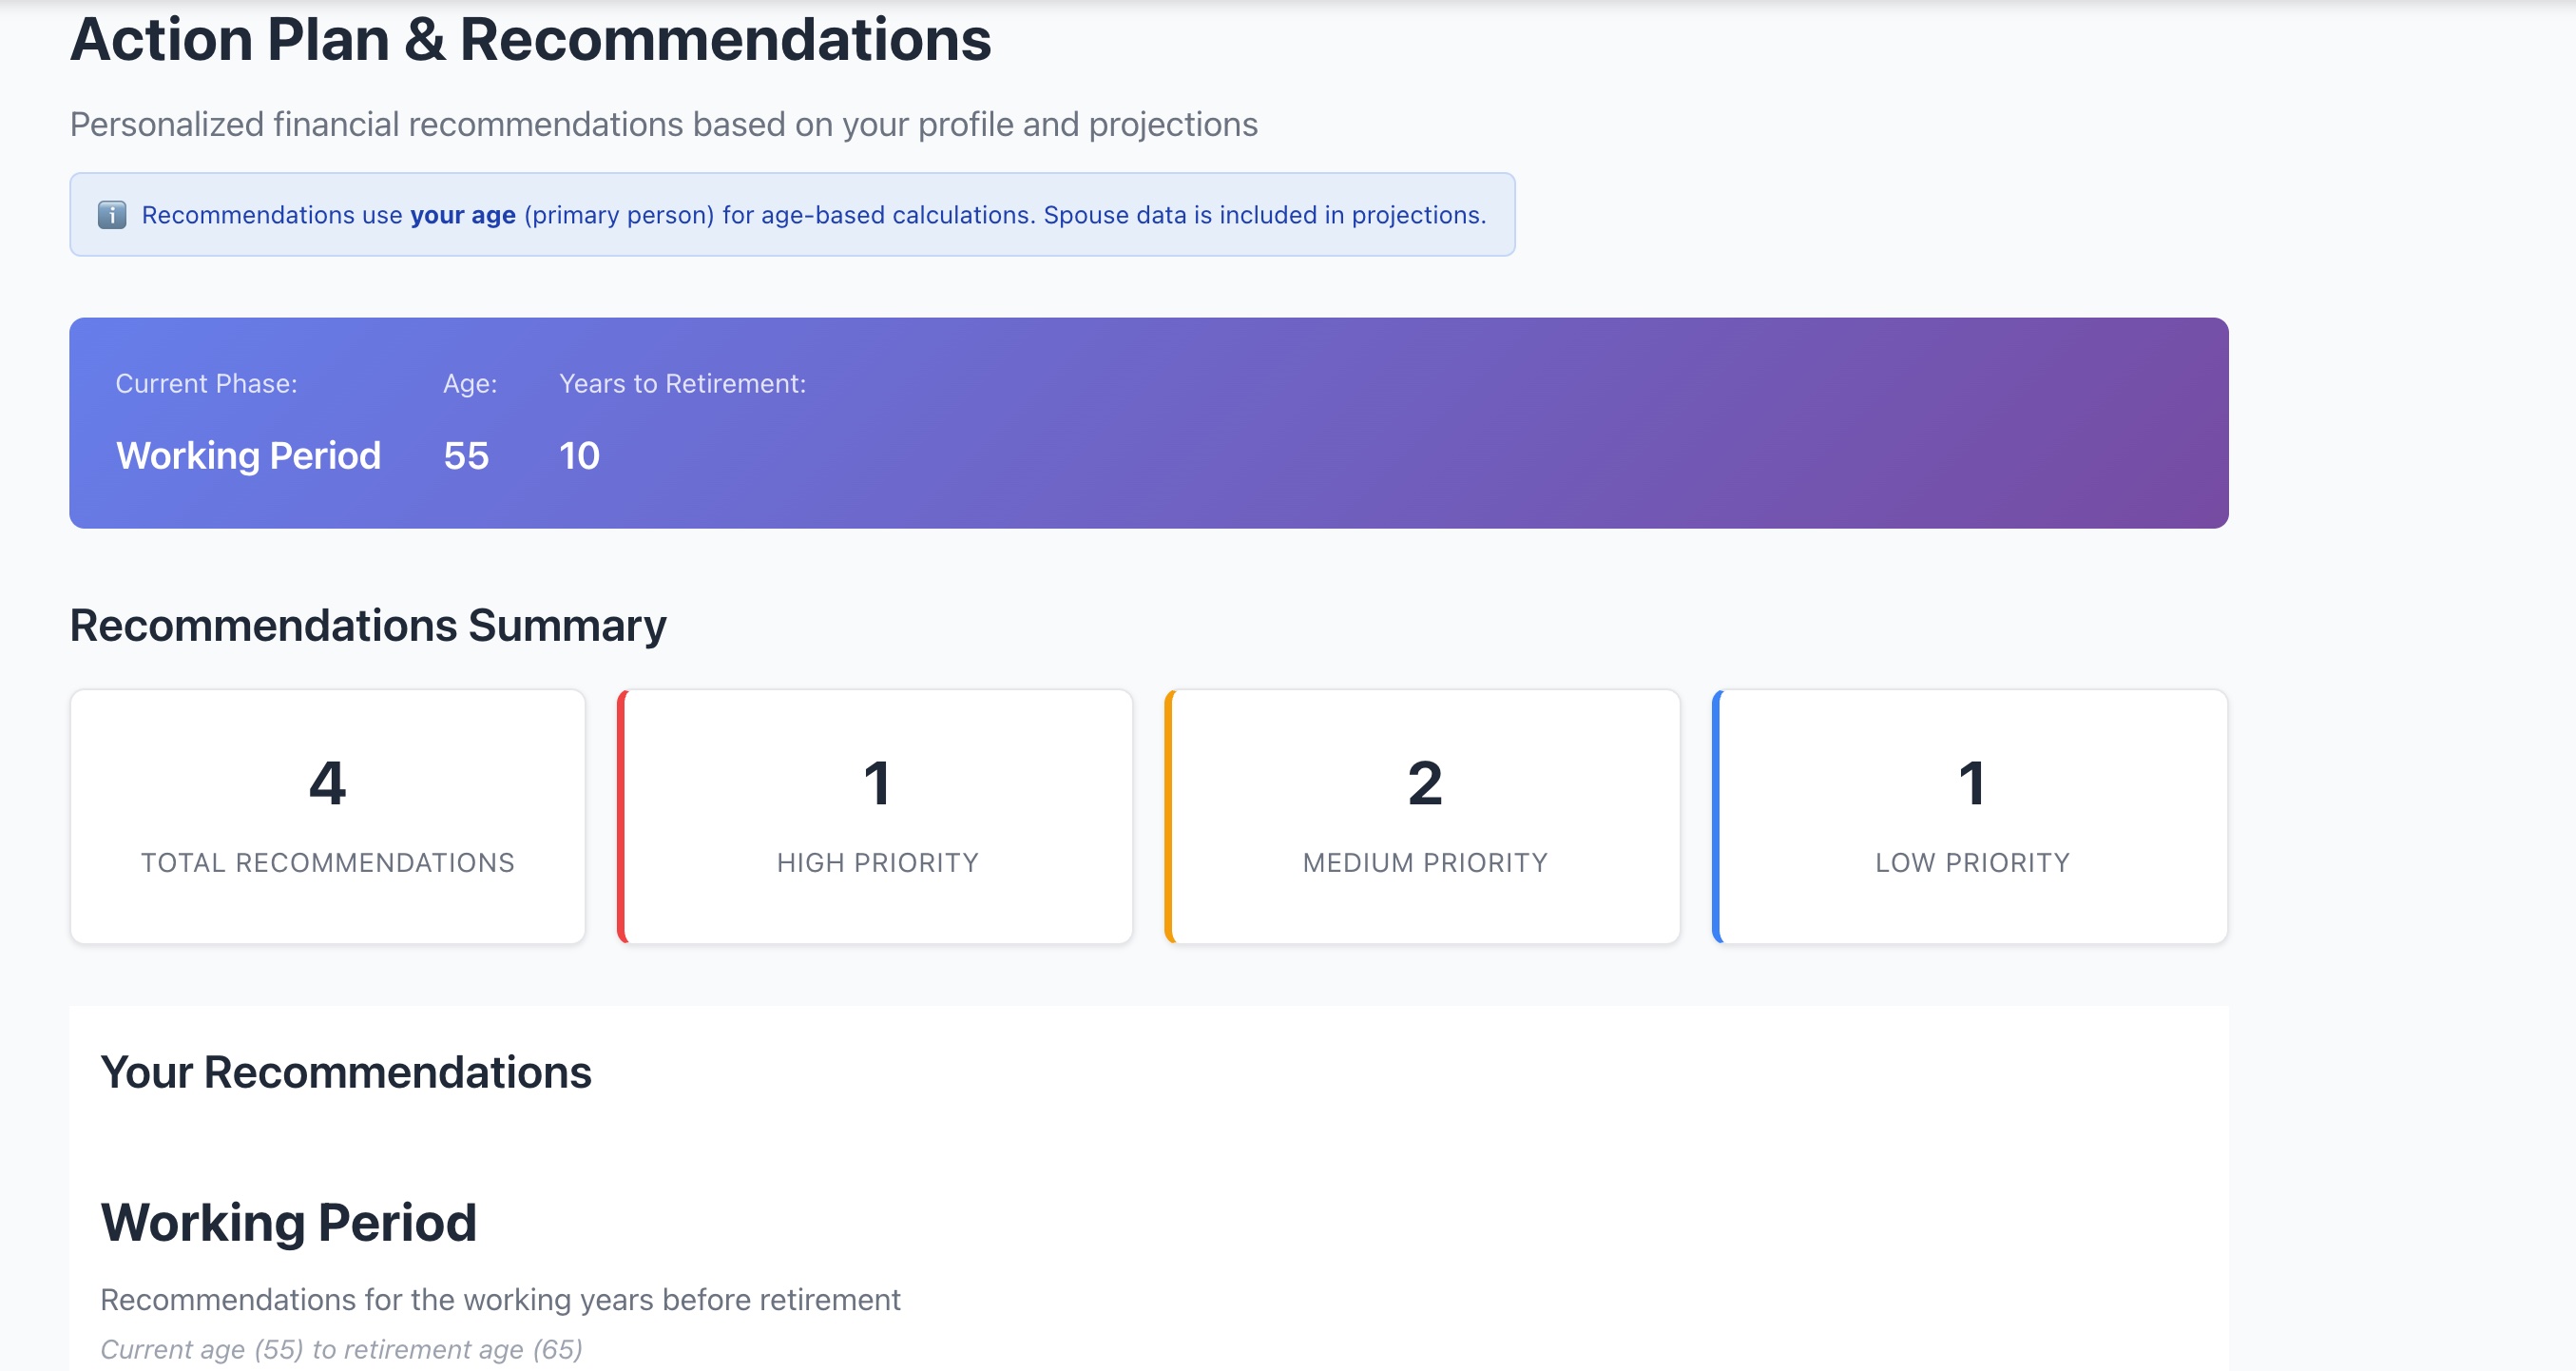
Example: prioritized items spanning working years through the retirement phases
7. Praxion AI Assistant
Praxion AI is your built-in AI planning assistant. It can answer questions about your plan, run what-ifs, and walk you through specific decisions — grounded in your actual profile.
What it is: A conversational assistant that can analyze your plan, run tools, and give structured decision answers.
Where to find it: Left sidebar → Praxion AI (route /praxion-ai), or the floating "Ask Praxion AI" drawer on the dashboard. "Improve your plan" cards also offer "Answer with Praxion AI".
How to use it: Ask a question in plain language, or tap a suggested prompt. Share or export any answer.
What Praxion AI Can Do
- Answer questions about your plan and run what-if scenarios
- Run Roth, Social Security, and tax optimization analysis on demand
- Help fill in or update your profile, with deep links to the right Edit Profile section
- Run Income Planner scenarios from the conversation
- Give structured decision answers for specific questions — for example, a Roth vs Traditional 401(k) split or HSA contribution priority
8. AI & Automation Features
Beyond the assistant, Praxion includes several AI-driven features that monitor and improve your plan.
🤖 AI Review (Scenario Analysis)
What it is: An on-demand AI review that proposes Roth and strategy edits you can apply with one click.
Where to find it: Overview hero → "Run AI Scenario Analysis".
How to use it: Run it, review the proposed changes in the modal, and apply the ones you want.
💙 Data Health
What it is: A plan-confidence workspace: a Data Health score, balance reconciliation, plan-health signals, a market-shock simulation, and AI nudges.
Where to find it: Dashboard → Data Health tab (Power mode), or the Data Health gauge on the Overview.
How to use it: Review your signals, run the −5% / −10% / −20% shock test, and act on the AI nudges.
✨ AI Optimizer
What it is: Compares your live portfolio to your plan path, simulates drops, and suggests AI-vetted changes you can apply or revert.
Where to find it: Dashboard → AI Optimizer tab (unlocks at 100% completeness).
How to use it: Review a suggestion, apply it (or revert), and track everything in the Strategy Change History with one-click revert.
🎯 Confidence Grid & Scenario Lab
What it is: The Overview success ring is powered by a Confidence Grid; the Scenario Lab lets you move sliders and push changes into your plan.
Where to find it: Overview hero (Power mode).
How to use it: Adjust the Scenario Lab sliders, then choose "Apply to Base Plan" to keep the changes.
🛡️ Plan Stewardship
What it is: Controls how much Praxion automates monitoring and plan improvements.
Where to find it: Settings → Plan Stewardship.
How to use it: Choose Watch & Notify (default), Auto-Apply (with a 7-day undo window), or Manual Only.
🔔 Praxion Alerts
What it is: A unified notification inbox combining server alerts (market drift, IRMAA cliffs, stale balances) with plan, Roth, and cash-flow nudges.
Where to find it: The bell icon in the top navigation.
How to use it: Open the bell to review and act on alerts as they arrive.
9. Planning Tools (Explorers)
The left sidebar groups your tools under My Plan and Explorers. Explorers currently includes 19 tools across four groups.
My Plan
- Overview — your dashboard (
/dashboard) - Edit Profile — your plan inputs (
/onboardingv2) - Praxion AI — the AI assistant (
/praxion-ai) - Financial Journey — year-by-year detail (
/projection-details) - Action Plan & Analysis — prioritized recommendations (
/action-plan) - Advisor Report — an exportable report (
/report) - Charts — visual projections (
/charts) - Scenario Studio — single-variable what-if analysis (
/scenario-studio)
Explorers
/rmd-insights through dashboard links, though it is no longer listed under Explorers.🎲 Monte Carlo
Runs up to 1,000 randomized market simulations to estimate the probability your plan succeeds, accounting for market volatility and the order of returns.
📸 Monte Carlo: success probability across randomized markets
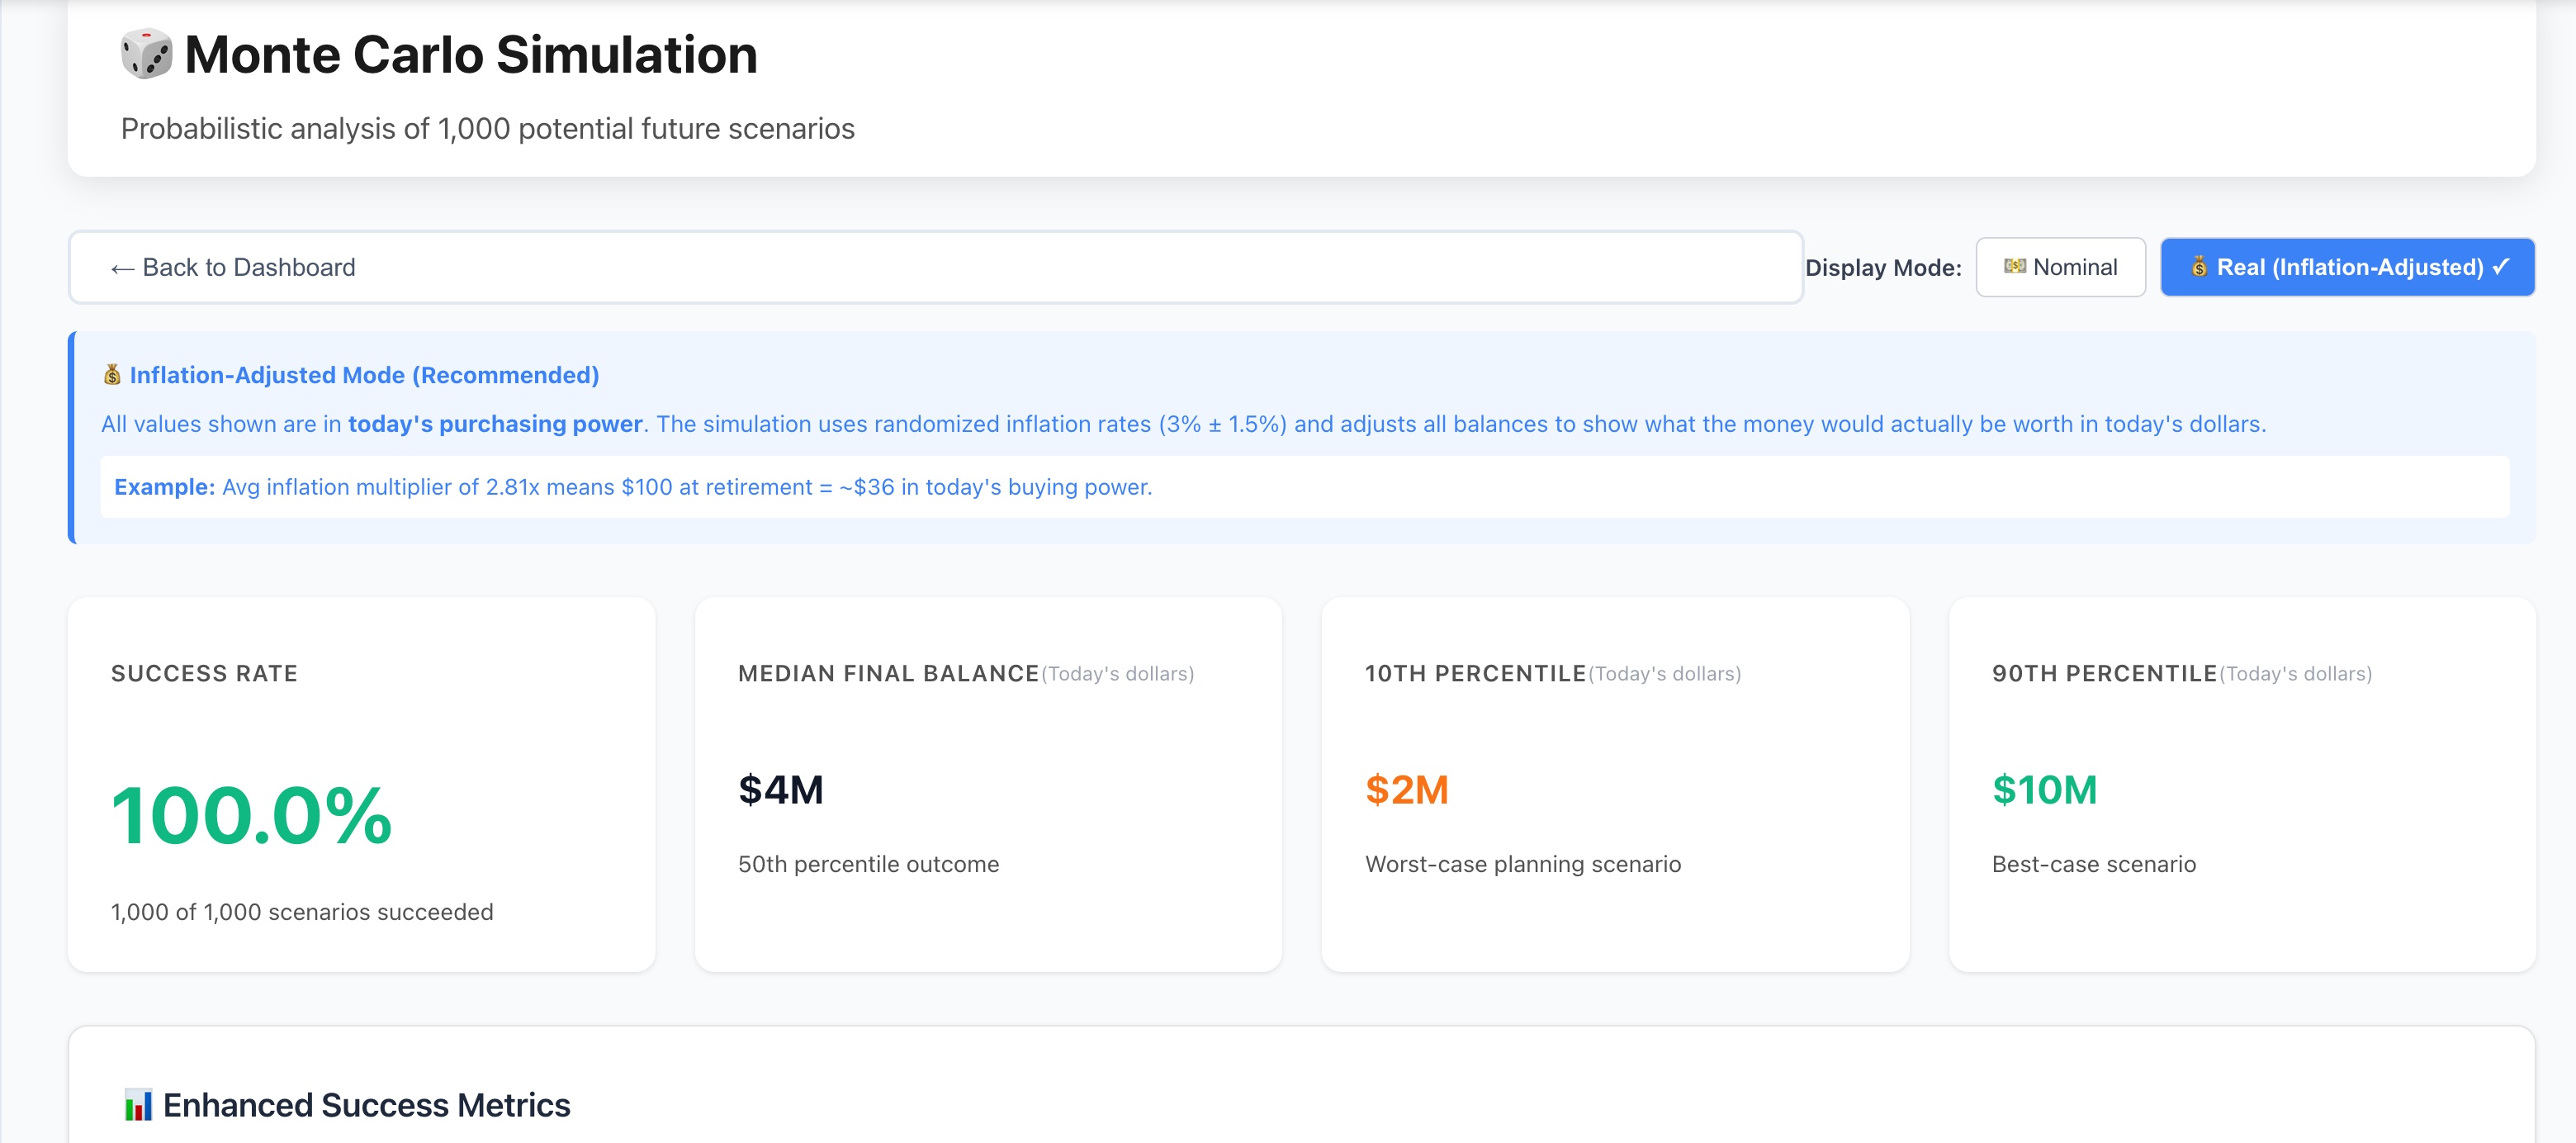
Example: a well-funded plan succeeding across nearly all market scenarios
⚖️ Strategy Comparison
Compare withdrawal strategies side-by-side to find the best approach for your plan.
- Methods: Expense-based, 4% Rule, Fixed Amount, Guardrails, and Hybrid
- Optimization modes: Static (your bucket order), AI Tax-Optimized, and Policy Engine
- Metrics: lifetime taxes, extra RMDs, final assets, and success rate
📸 Strategy Comparison: withdrawal methods
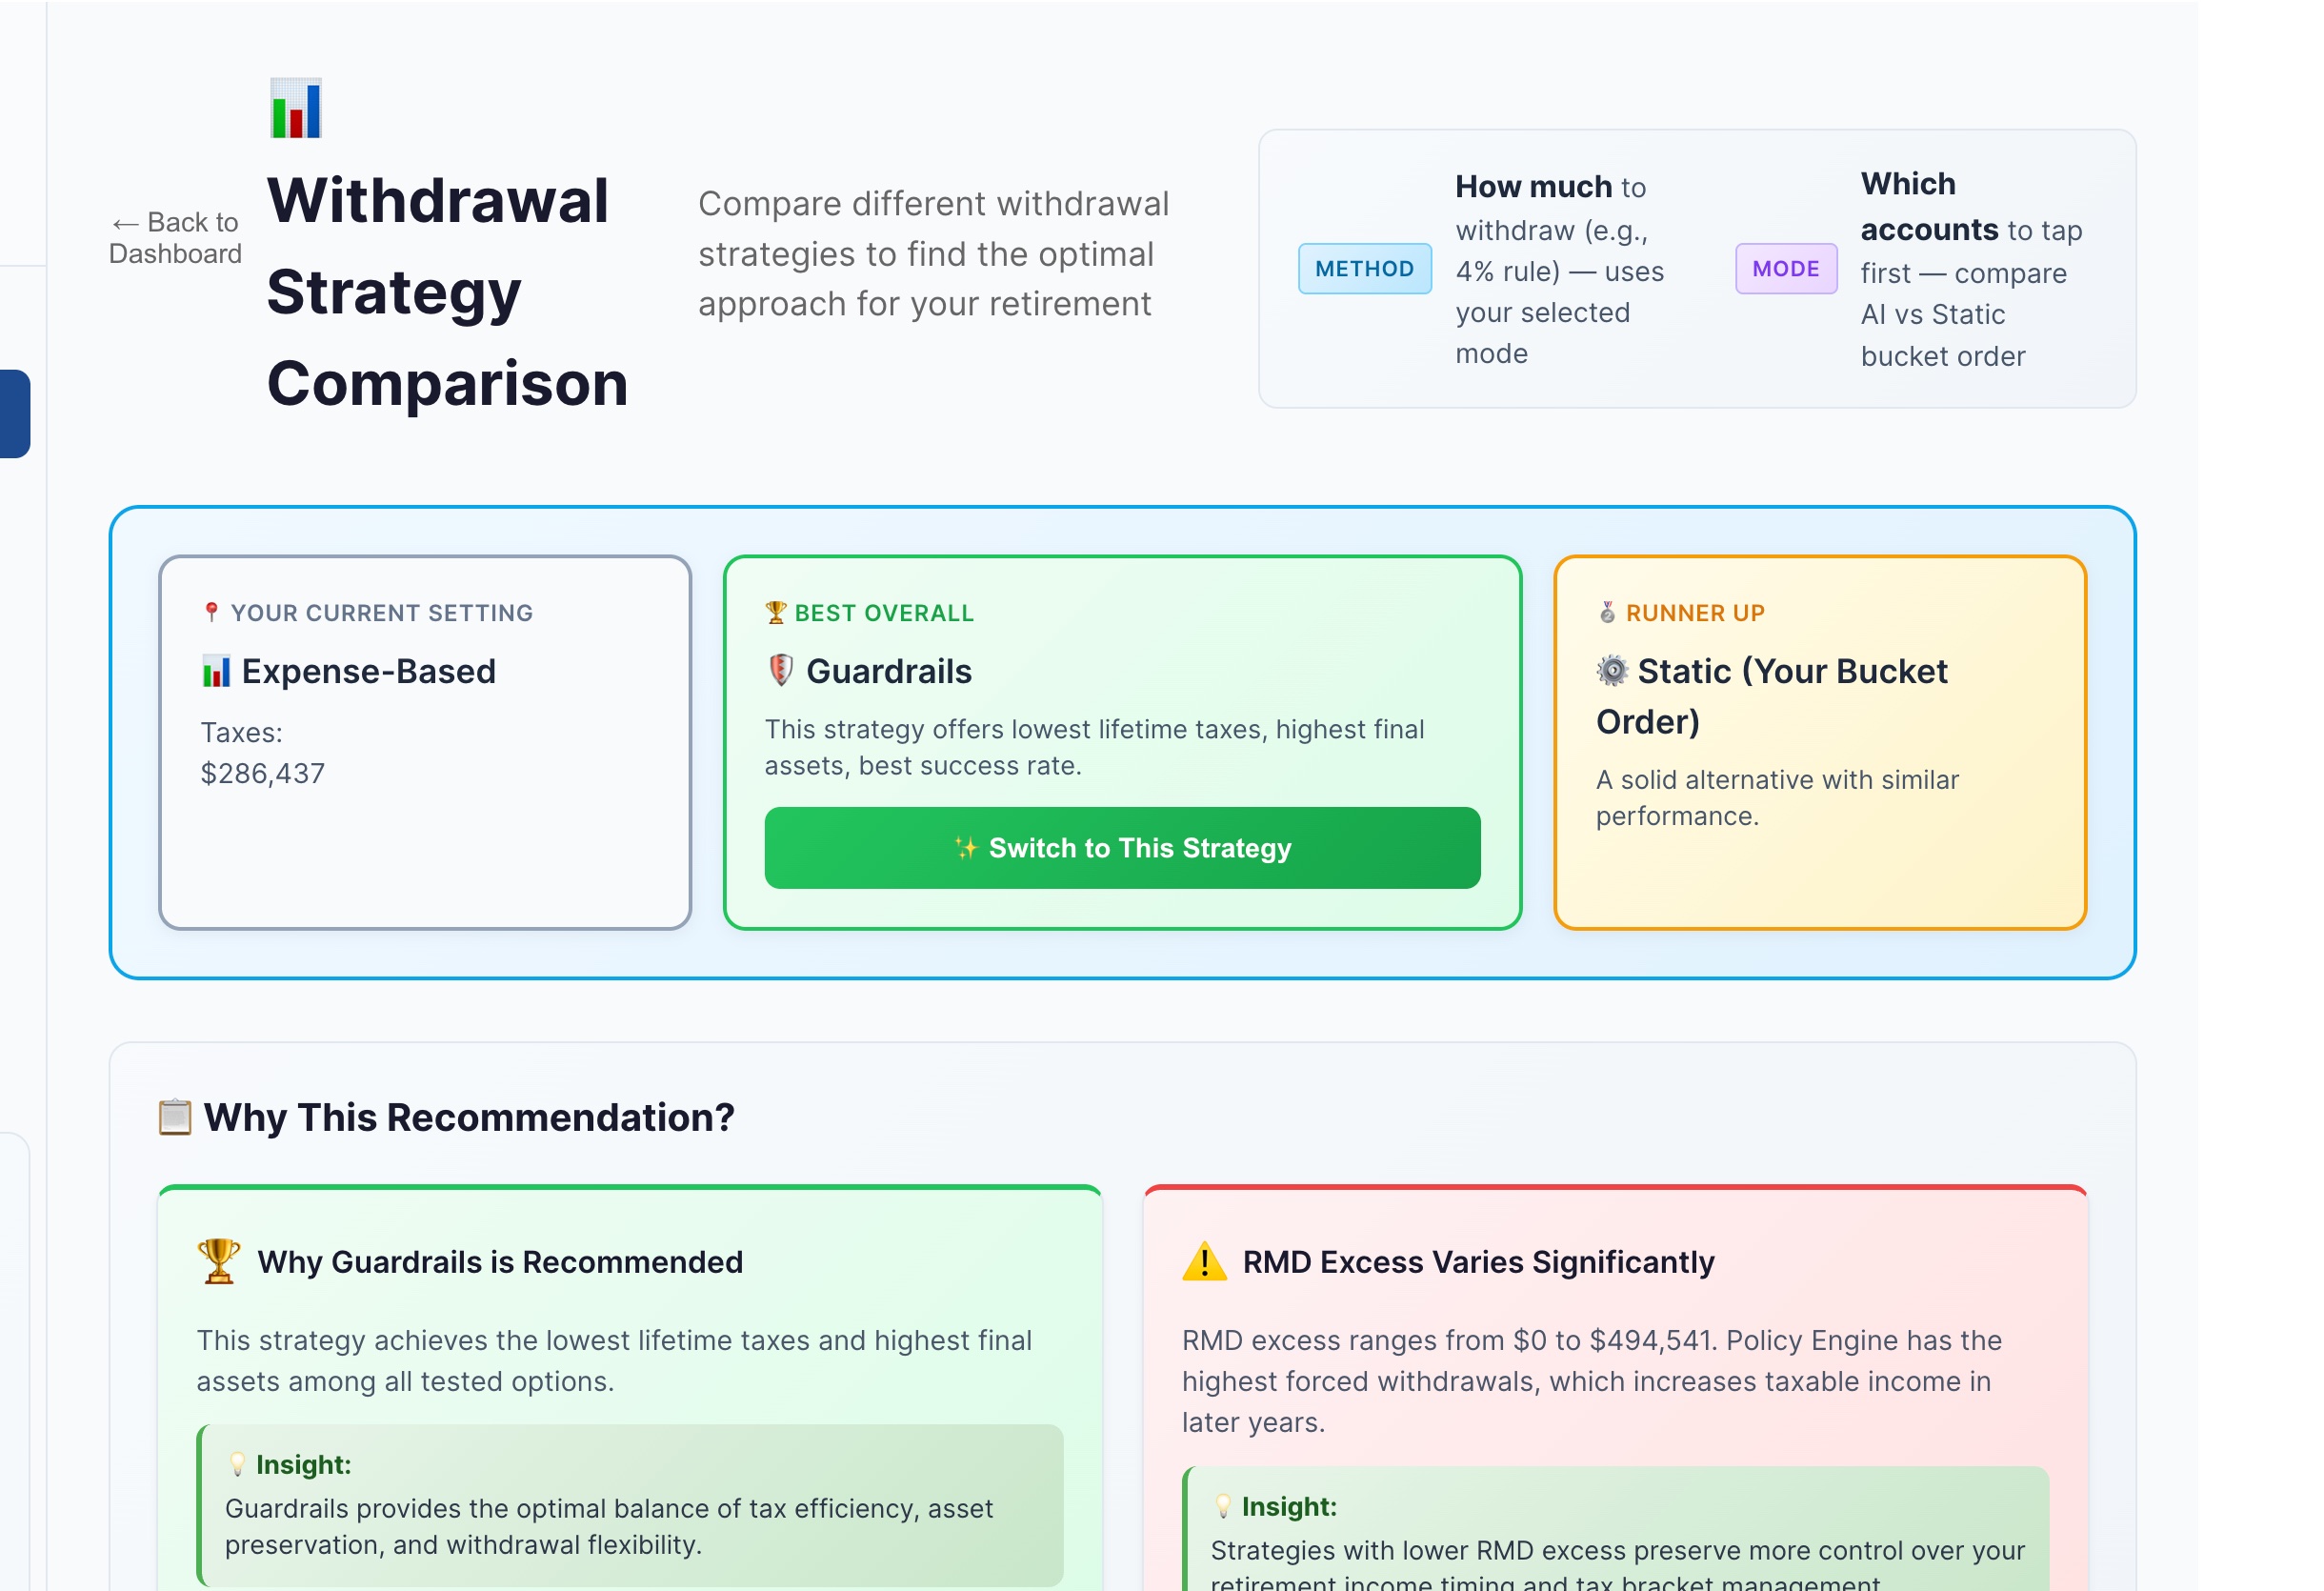
Compare Expense-based, 4% Rule, Fixed Amount, Guardrails, and Hybrid
📸 Strategy Comparison: optimization modes
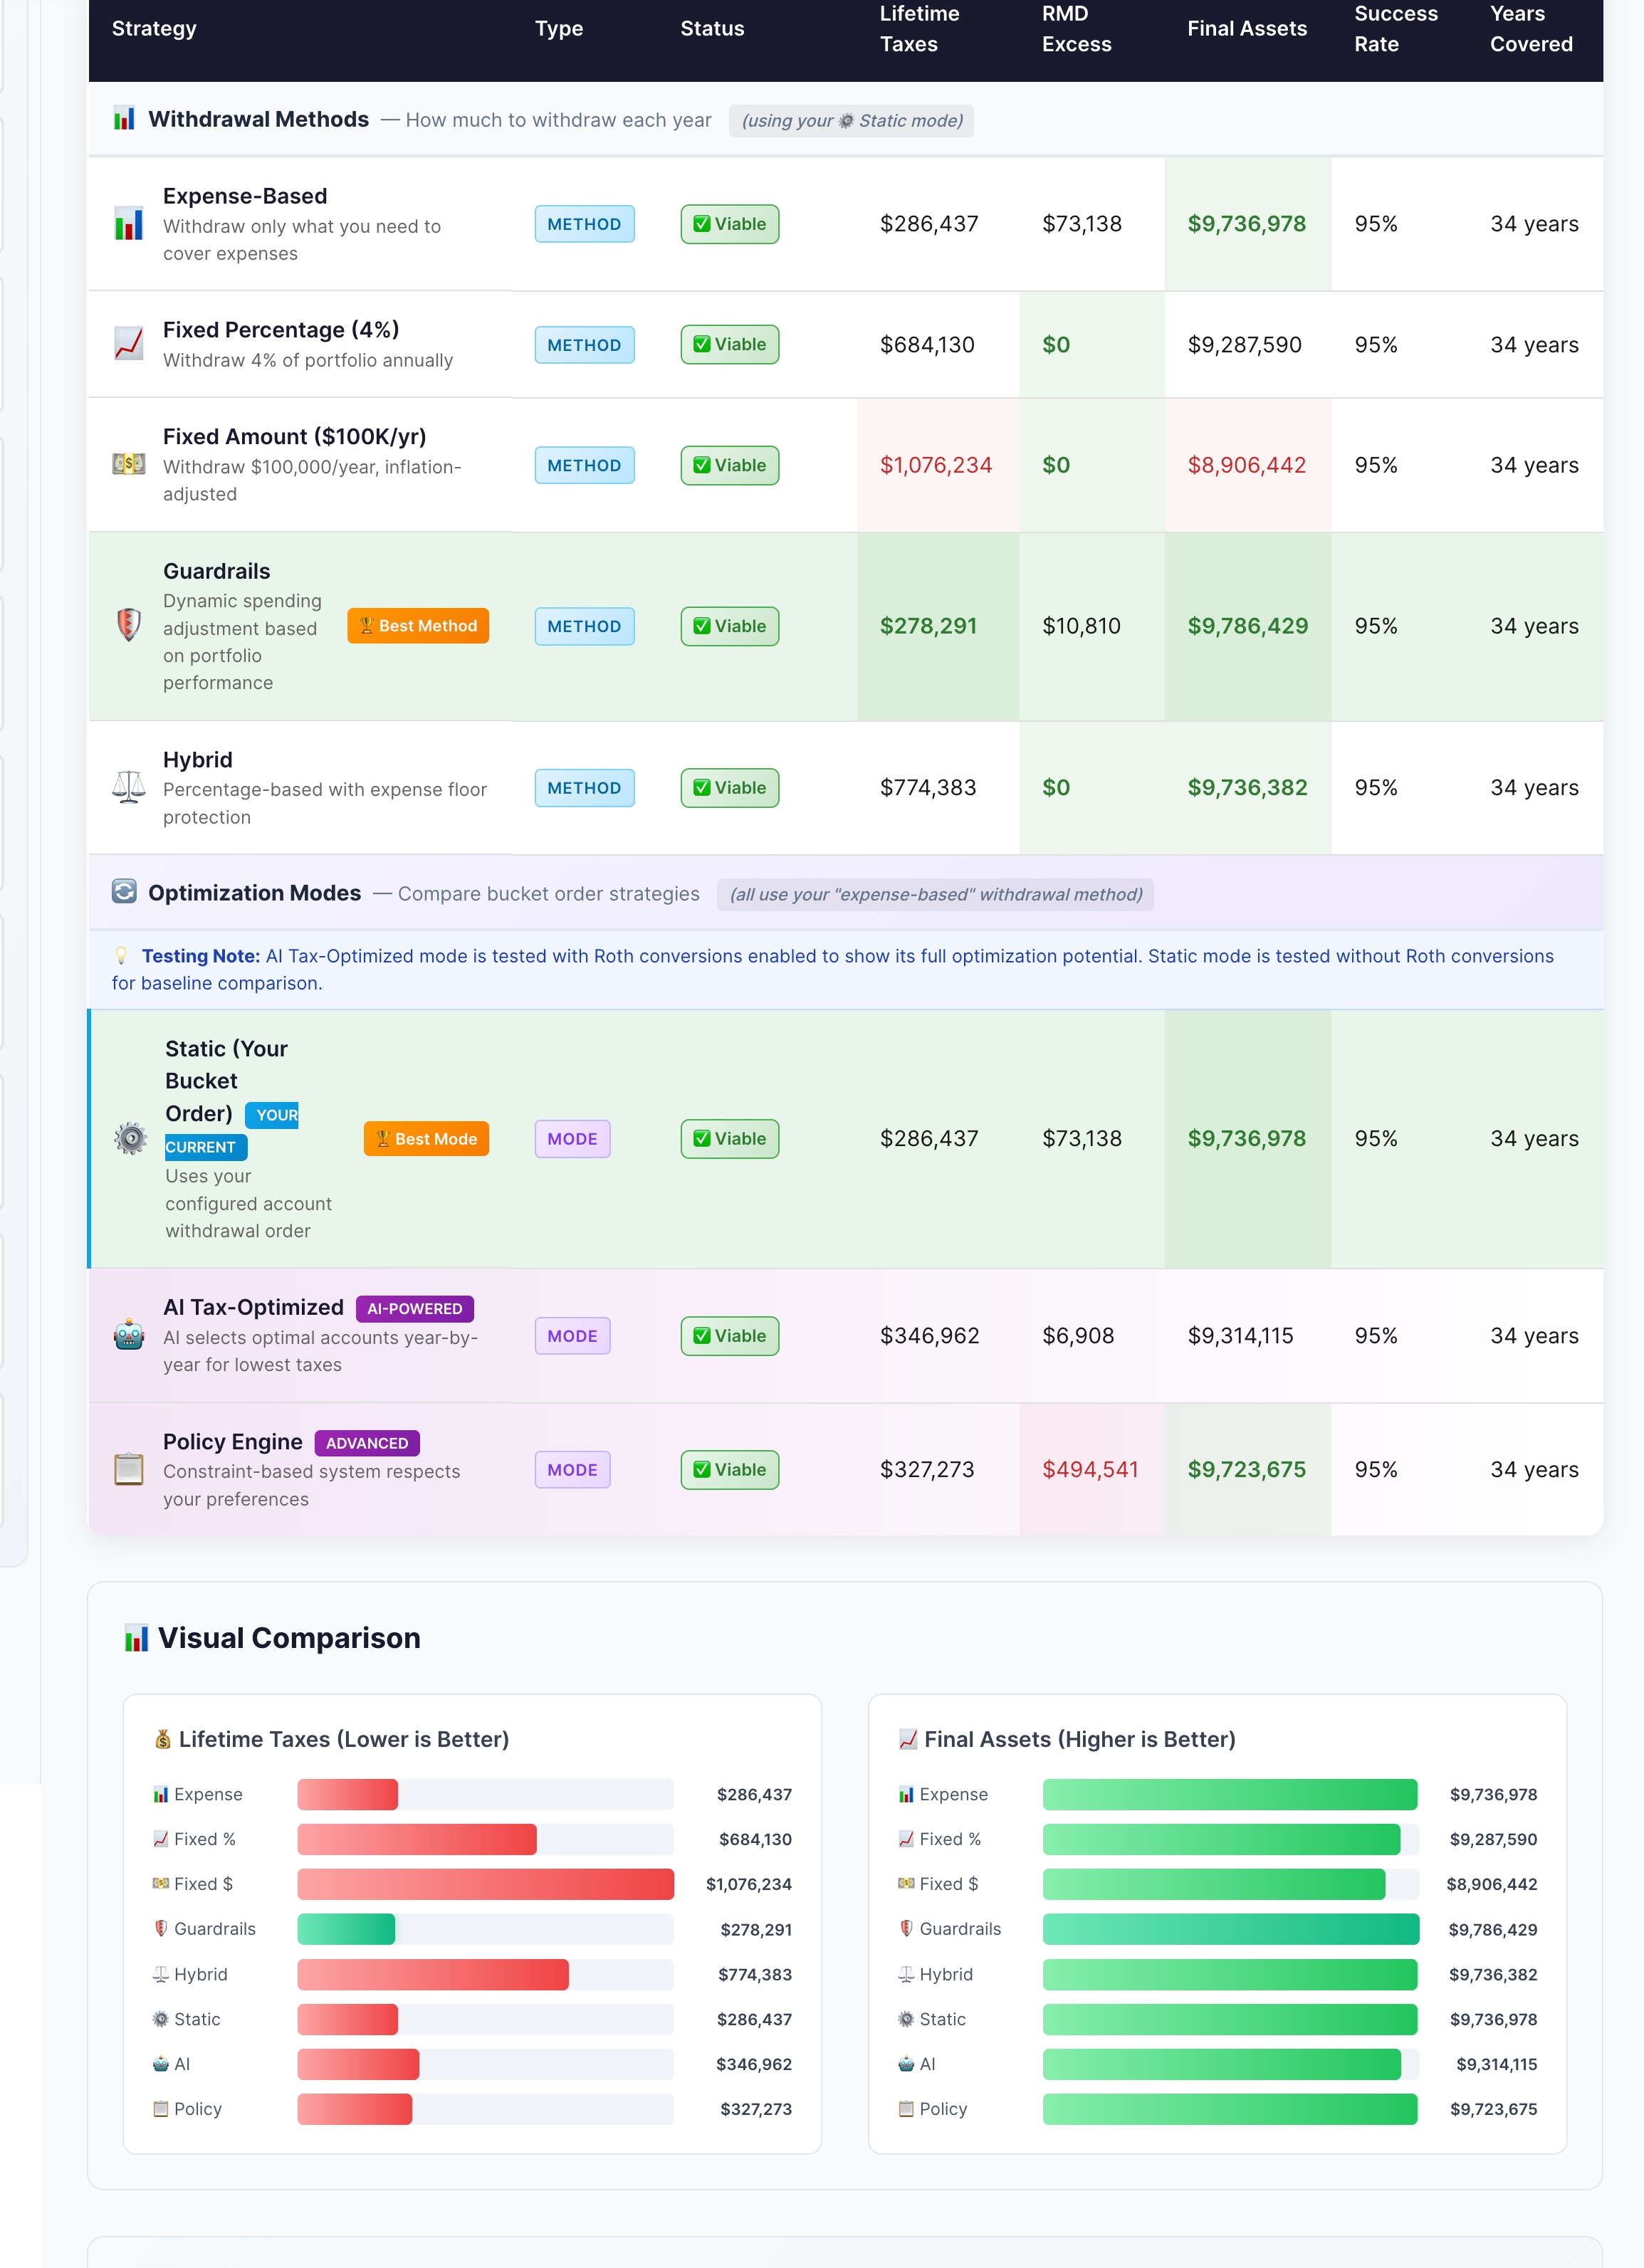
Compare Static (your bucket order), AI Tax-Optimized, and Policy Engine
📊 Advisor Report
What it is: An institutional-style report with narrated sections that you can export.
Where to find it: Left sidebar → Advisor Report (route /report).
How to use it: Generate the report, review it in the browser, then export to PDF or HTML. Requires 100% completeness and a free account.
Other Explorers at a Glance
- Stress Test — how your plan would have weathered real crises (2008, 2000, 1970s, 1987)
- Historical Market Replay — replay your plan through a chosen historical period
- Can I Retire? and Retirement Number — quick readiness answers and your target number
- Social Security Strategy — claiming-age break-even, spousal, and tax analysis
- Tax & Liquidity — tax-aware funding and a liquidity stress score
- Inflation Dashboard, Estate Tracker, Spending Trade-offs, Life Expectancy, Withdrawal Guardrails, Cash Flow Analysis — lifestyle and longevity planning
10. Tax Optimization Suite
🔄 Roth Analyzer
Determines whether and how much to convert from Traditional to Roth each year, considering:
- Current versus future tax brackets
- Years until retirement and RMD reduction benefits
- IRMAA (Medicare surcharge) implications
- Legacy and estate goals
📸 Roth conversion window: tax-efficient conversion opportunities
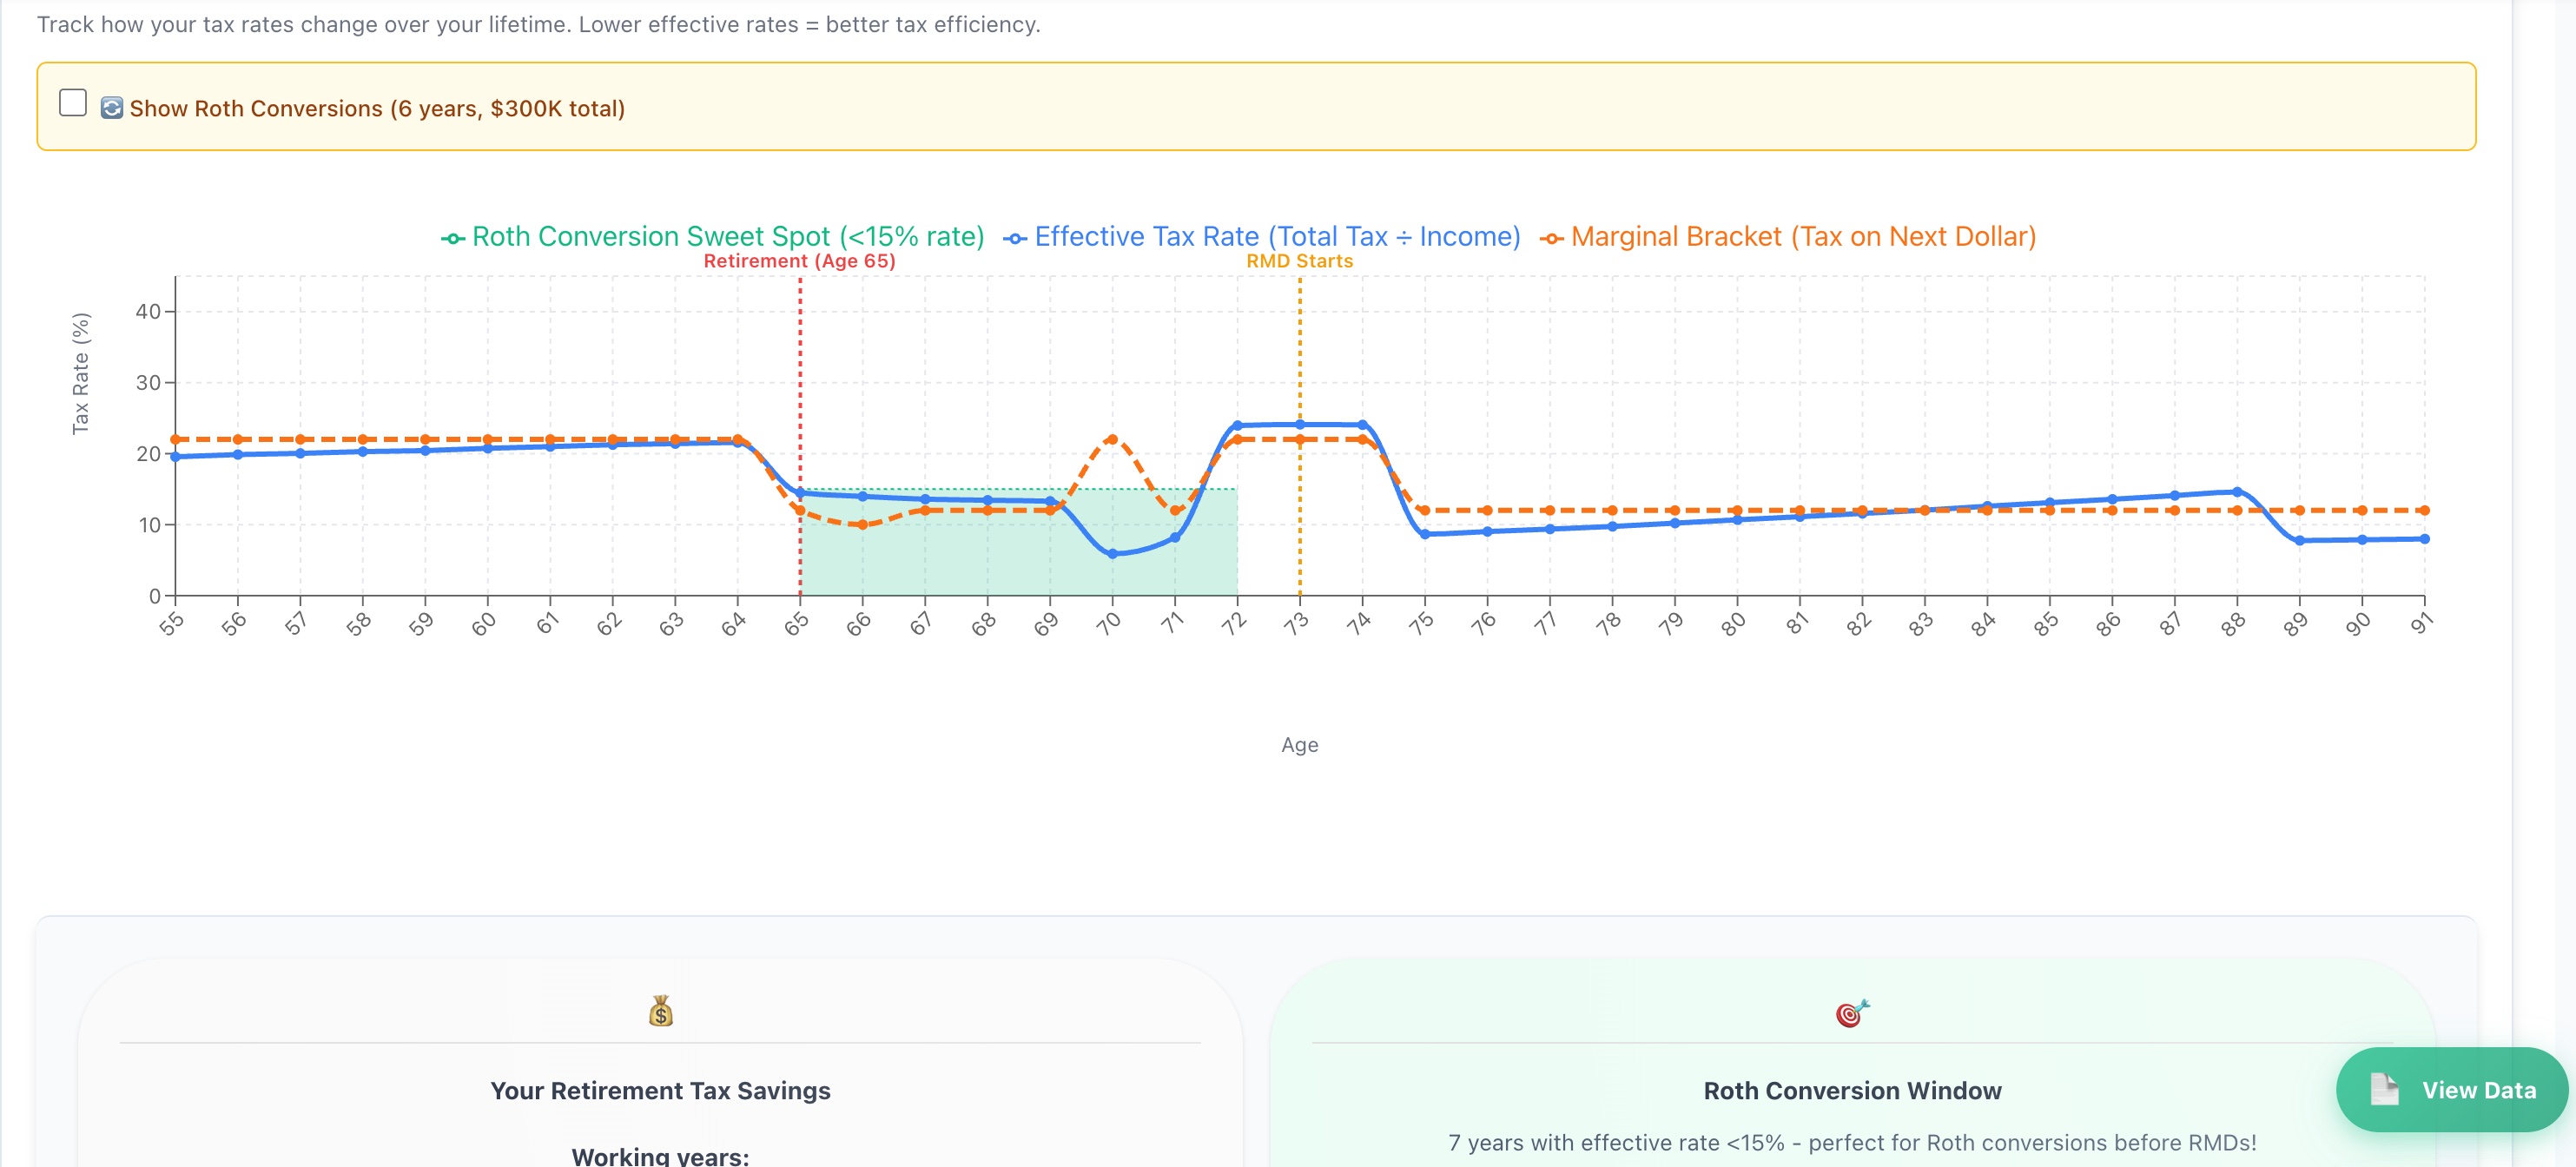
Example: the conversion window before RMDs begin at age 73
💹 Tax Optimizer
Lifetime tax scenario analysis across income timing, deductions, credits, and state considerations.
📈 Capital Gains & Tax-Loss Harvesting
One tool covers both: strategically realizing gains in low-income years to reset cost basis, and offsetting gains with losses in taxable accounts. (Tax-loss harvesting lives inside the Capital Gains tool.)
📋 RMD Insights
Required Minimum Distribution planning — projected RMDs, their tax impact, QCD opportunities, and ways to reduce future RMDs. Reachable from dashboard links at /rmd-insights.
11. Profiles & Scenarios
Profiles vs Scenarios
A Profile is a complete, independent plan. A Scenario is a what-if variation within a single profile that shares the same base data.
| Profiles | Scenarios | |
|---|---|---|
| Purpose | Completely different plans | Variations of the same plan |
| Data | Independent data sets | Shared base, modified assumptions |
| Use case | Major life decisions | Strategy optimization |
Scenario Studio
Scenario Studio (under My Plan) varies a single input across a range and shows the impact on key metrics — perfect for finding an optimal value such as the best Social Security claiming age or Roth conversion amount.
12. How We Calculate
Year-by-Year Methodology
For each year from now to the end of your plan, Praxion:
- Calculates income (salary, bonuses, Social Security, pensions, dividends, rental)
- Applies contributions (401(k), IRA, Roth, HSA) with employer match and catch-up
- Calculates inflation-adjusted expenses, healthcare, and life events
- Determines withdrawals to cover any gap
- Calculates federal, state, and FICA taxes plus capital gains
- Applies RMDs after age 73 (SECURE 2.0)
- Executes Roth conversions if enabled, within your constraints
- Grows remaining balances and carries forward to the next year
Tax Calculations
- Federal: progressive brackets (10%, 12%, 22%, 24%, 32%, 35%, 37%)
- State: state-specific brackets or flat rates for all 50 states
- FICA: Social Security 6.2% up to $184,500 + Medicare 1.45% (+0.9% above $200K)
- Capital gains: 0%, 15%, or 20% by income level
- NIIT: 3.8% net investment income tax above thresholds
- Social Security taxation: 0%, 50%, or 85% of benefits taxable by combined income
Monte Carlo Methodology
- Runs up to 1,000 independent simulations per analysis
- Each uses randomized annual returns based on historical distributions
- Equity volatility is modeled at roughly 18% standard deviation
- Returns flow through your full projection with all tax and withdrawal logic
- Success = a positive ending balance at your planning horizon
13. Data Sources & IRS Limits
2026 IRS Limits (Current Year)
| Limit | Under 50 | 50+ (w/ Catch-up) |
|---|---|---|
| 401(k) Contribution1 | $24,500 | $32,500 (+$8,000) |
| 401(k) Super Catch-up (60-63)1,2 | — | $35,750 (+$11,250) |
| IRA Contribution1 | $7,500 | $8,600 (+$1,100) |
| HSA (Individual)3 | $4,400 | $5,400 (+$1,000) |
| HSA (Family)3 | $8,750 | $9,750 (+$1,000) |
| Social Security Wage Base4 | $184,500 | |
1 IRS Notice 2025-67 (Retirement Plan Limits for 2026)
2 SECURE 2.0 Act enhanced catch-up contribution for ages 60-63
3 IRS Rev. Proc. 2025-25 (HSA Limits for 2026)
4 Social Security Administration announcement (October 2025)
Data Sources
- IRS Notice 2025-67: 2026 retirement plan contribution limits
- IRS Rev. Proc. 2025-32: 2026 tax bracket inflation adjustments
- IRS Rev. Proc. 2025-25: 2026 HSA limits
- IRS Publication 590-B: IRA contribution and RMD rules
- SSA.gov: Social Security wage base and benefit formulas
- CMS Medicare Announcement: 2026 Part B/D premiums and IRMAA thresholds
- State Tax Authorities: state-specific tax brackets
14. Tips, FAQ & Glossary
For Accurate Projections
- Use actual balances from your statements, not estimates
- Include all income — Social Security, pensions, rental, part-time work
- Plan for healthcare — costs typically rise in retirement
- Update annually, ideally after tax season
- Reach 100% completeness to unlock the full plan and reports
Optimization Tips
- ✅ Max your employer 401(k) match first — it is free money
- ✅ Consider Roth conversions in low-income years (early retirement, before RMDs)
- ✅ Coordinate Social Security claiming as a couple
- ✅ Use the HSA as a stealth retirement account (triple tax advantage)
- ✅ Run scenarios before any major decision
Frequently Asked Questions
Is Praxion Finance really free?
Yes — core features are free with no credit card required. Some premium areas may require a free account.
What is the difference between Quick Start and Edit Profile?
Quick Start is a short guided wizard that gets you to a working plan fast. Edit Profile is the full card dashboard where you refine every detail. You can move between them anytime.
What are Guided, Standard, and Power modes?
They control how much the dashboard shows. Guided is a checklist for new plans, Standard shows three core tabs, and Power reveals the full eight-tab strip (Analysis, Projections, Income Planner, Data Health, AI Optimizer). Switch modes from the dashboard header.
What is Praxion AI and is my data used to train it?
Praxion AI is an assistant that answers questions and runs analysis using your profile. It helps you plan; it does not connect to your real financial accounts. Always review AI output and consult a professional for major decisions.
Why are some tabs or the Advisor Report locked?
My Plan, AI Optimizer, and the Advisor Report unlock at 100% profile completeness. Premium tabs ask guests to create a free account. Use "See Everything" to preview with estimated defaults.
How accurate are the projections?
Calculations follow standard planning methodology, but accuracy depends on your inputs and markets are unpredictable. Use Monte Carlo for probability-based analysis, and treat results as educational, not advice.
Glossary
📝 About This Guide
This guide was created with AI-assisted content generation and reviewed by Praxion Finance LLC. Screenshots and examples use sample data for illustration. Praxion is for educational purposes only and does not constitute financial advice — please consult a qualified professional for personalized guidance.
Last updated: June 2026 • © 2026 Praxion Finance LLC
Ready to Plan Your Future?
Create your free account and build your personalized retirement plan in minutes. No credit card required — ever.