Social Security Benefits Estimator: What You'd Get at 62, FRA, and 70
Estimate your monthly benefit at each claiming age, then see how taxes and timing change what you keep.
Planning for Social Security can feel overwhelming. With multiple claiming ages, complex tax rules, and strategies to maximize lifetime benefits, it's easy to wonder: How much will I get, and when should I claim?
The estimator below shows your monthly benefit at 62, full retirement age, and 70. To compare claiming ages side by side and find your break-even age, use our free Social Security analyzer and break-even calculator.
See what you'd get at 62, FRA, and 70
Enter your birth year, income, and years worked for a rough monthly estimate.
Your total working years, capped at 35.
Enter your details to see your estimate.
Claim at 62
—
At your FRA
—
Claim at 70
—
Rough estimate based on your current income and years worked. For your exact benefit, log into SSA.gov/myaccount.
Show advanced options
These inputs project your income forward and recompute the estimate — adjust them to see how your benefit changes based on when you retire and how your salary grows.
Sets the horizon — how many years to project your income before computing the estimate.
Annual growth applied to your current income each year until retirement.
Ready to plan your full retirement? Start your free plan →
Why Timing Matters: The Impact of Your Claiming Age
The age at which you claim Social Security has a dramatic impact on your monthly and lifetime benefits. Here's how claiming age affects your monthly benefit amount:
Social Security Claiming Ages
- Age 62 (Early Claiming): Reduces your monthly benefit by up to 30%, but provides income sooner. Often fits if you need income now or expect a shorter life.
- Full Retirement Age (FRA, typically 67): Receive 100% of your calculated benefit. The "baseline" for comparison.
- Age 70 (Maximum Delay): Increases your benefit by roughly 8% per year beyond FRA, maximizing monthly payments. Often fits longer lives, tax management, or those with other income sources.
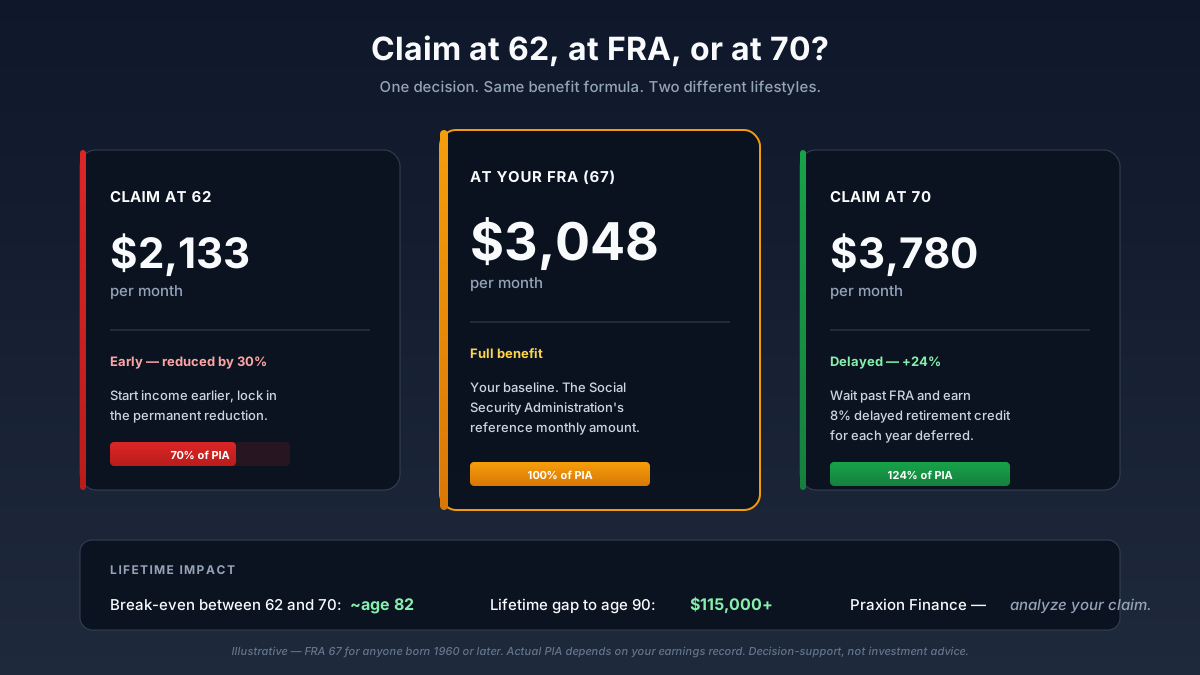
Example: If your Full Retirement Age benefit is $3,048/month:
- Claiming at 62: ~$2,133/month (30% reduction)
- Claiming at 67 (FRA): $3,048/month (100%)
- Claiming at 70: ~$3,780/month (24% increase)
💡 It's Not Just About the Numbers
Choosing the right age isn't just about maximizing monthly payments. Factors like your adjusted life expectancy, current savings, tax situation, spousal coordination, and other sources of income all influence which age fits your retirement.
Social Security Break-Even Analysis: When Does Delay Pay Off?
Break-even analysis compares cumulative lifetime Social Security benefits at different claiming ages. Claim at 62 and you collect smaller checks for longer; delay to 70 and you collect larger checks for fewer years. The break-even age is the point where the “delayed but larger” cumulative total catches up to the “early but smaller” total — typically somewhere between age 78 and 82 for the FRA-vs-70 decision, depending on your COLA assumption.
Three factors shift your personal break-even year: longevity (SSA period life tables show most healthy 65-year-olds today live well past their break-even age), COLA (higher COLA compounds the “delayed but larger” side faster), and taxation of benefits(delayed claims often coincide with lower withdrawal income, keeping more of the SS benefit tax-free).
Try our free Social Security analyzer and break-even calculator → to see your personalized break-even ages, cumulative benefit tables at 62 / FRA / 70, and how COLA compounds over 30+ years of retirement. No signup required.
How Taxes Affect Social Security Benefits
Here's a critical fact many retirees overlook: up to 85% of Social Security benefits may be taxable. Your tax liability depends on your provisional income, which includes:
- Adjusted Gross Income (AGI)
- Nontaxable interest (e.g., municipal bonds)
- 50% of your Social Security benefits
Social Security Taxation Thresholds
| Filing Status | Provisional Income | Taxable % |
|---|---|---|
| Single | < $25,000 | 0% |
| Single | $25,000 – $34,000 | 50% |
| Single | > $34,000 | 85% |
| Married (Joint) | < $32,000 | 0% |
| Married (Joint) | $32,000 – $44,000 | 50% |
| Married (Joint) | > $44,000 | 85% |
A useful claiming comparison factors in these thresholds, so you see your after-tax income—not just gross benefits.
⚠️ Tax Planning Opportunity
Strategic timing of Social Security claiming, combined with Roth conversions and withdrawal sequencing, can significantly reduce lifetime taxes. Many retirees leave tens of thousands on the table by not considering tax implications of their claiming decision.
Understanding Opportunity Cost: What You Gain by Waiting
Every decision has trade-offs. By claiming early, you gain immediate income but miss out on the higher benefits that come from delaying. By waiting, you increase monthly payments but forgo years of benefits you could have received (and potentially invested).
What a Claiming Comparison Calculates
- Benefits received during the delay period: Total income you'd receive by claiming earlier
- Annual benefit increases: How much your monthly payment grows by waiting
- Break-even age: The age at which delayed benefits surpass early claiming
- Investment potential: Value of investing early benefits vs. receiving higher payments later
- Lifetime value: Total benefits over different life expectancies
Example Scenario:
Delaying from age 62 to 70 could increase your lifetime benefits by over $400,000, depending on your life expectancy and investment strategy. However, if you have poor health or limited life expectancy, claiming early and investing the benefits might provide better outcomes.
Break-Even Analysis
If you delay claiming from 67 to 70 (gaining 24% higher monthly benefits), you typically break even around age 80-82. If you expect to live beyond that age, delaying often provides greater lifetime value. If you don't expect to reach that age, claiming earlier may make sense.
The Social Security analyzer and break-even calculator shows when you break even under different life expectancies.
Social Security Analysis in Your Praxion Plan
Inside a Praxion plan, Social Security analysis goes beyond a basic calculator. It works with your complete retirement plan to provide:
✓ Modeled Preferred Claiming Age (Net Total Wealth)
Most calculators stop at the Social Security break-even age—a Social-Security-in-isolation view. Praxion goes further: it models your total household wealth at each claiming age from 62 to 70, folding in federal taxes on benefits, the portfolio you draw down while you wait (the bridge cost), survivor benefits, and your modeled longevity—then surfaces a preferred claiming age for your plan. When several ages land within a small margin of each other, it says so plainly (a “close call,” with the trade-off shown) rather than forcing a false single answer. The Social-Security break-even and lifetime totals are still shown—as clearly-labeled facts, not the recommendation. Praxion Finance is a decision-support tool, not a registered investment adviser.
✓ Personalized Analysis
Tailored claiming strategies based on your adjusted life expectancy, savings, spouse's benefits, and income sources. Not generic averages—analysis specific to your situation.
✓ Break-Even Analysis
Shows the precise age at which delayed benefits surpass early claiming. Visualize cumulative benefits over time and understand exactly when waiting pays off.
✓ Tax Implications
Visualizes how taxes impact your after-tax benefits at different claiming ages. See how provisional income thresholds affect your net income and coordinate with other tax strategies.
✓ Opportunity Cost Analysis
Demonstrates the value of waiting versus claiming early. Models what happens if you invest early benefits versus receiving higher payments later. Shows trade-offs with transparency.
✓ Advanced Scenario Planning
Combine Social Security with your investment portfolio to understand total retirement outcomes. Test different claiming ages alongside withdrawal strategies, Roth conversions, and market scenarios.
With Praxion Finance, you can:
- Compare claiming at 62, 67, and 70 in a single view
- See tax-adjusted monthly benefits for each scenario
- For couples: model both spouses' benefits and the survivor step-up, with each person's preferred age modeled against your household picture
- Rank claiming ages by total household net wealth—taxes, portfolio bridge, and longevity—not the break-even age alone
- Make data-driven decisions that align with your overall retirement goals
See Social Security Analysis in Action
Here's what you'll see in your plan's Social Security analysis. Below are three of its main views.
1. Side-by-Side Benefit Comparison
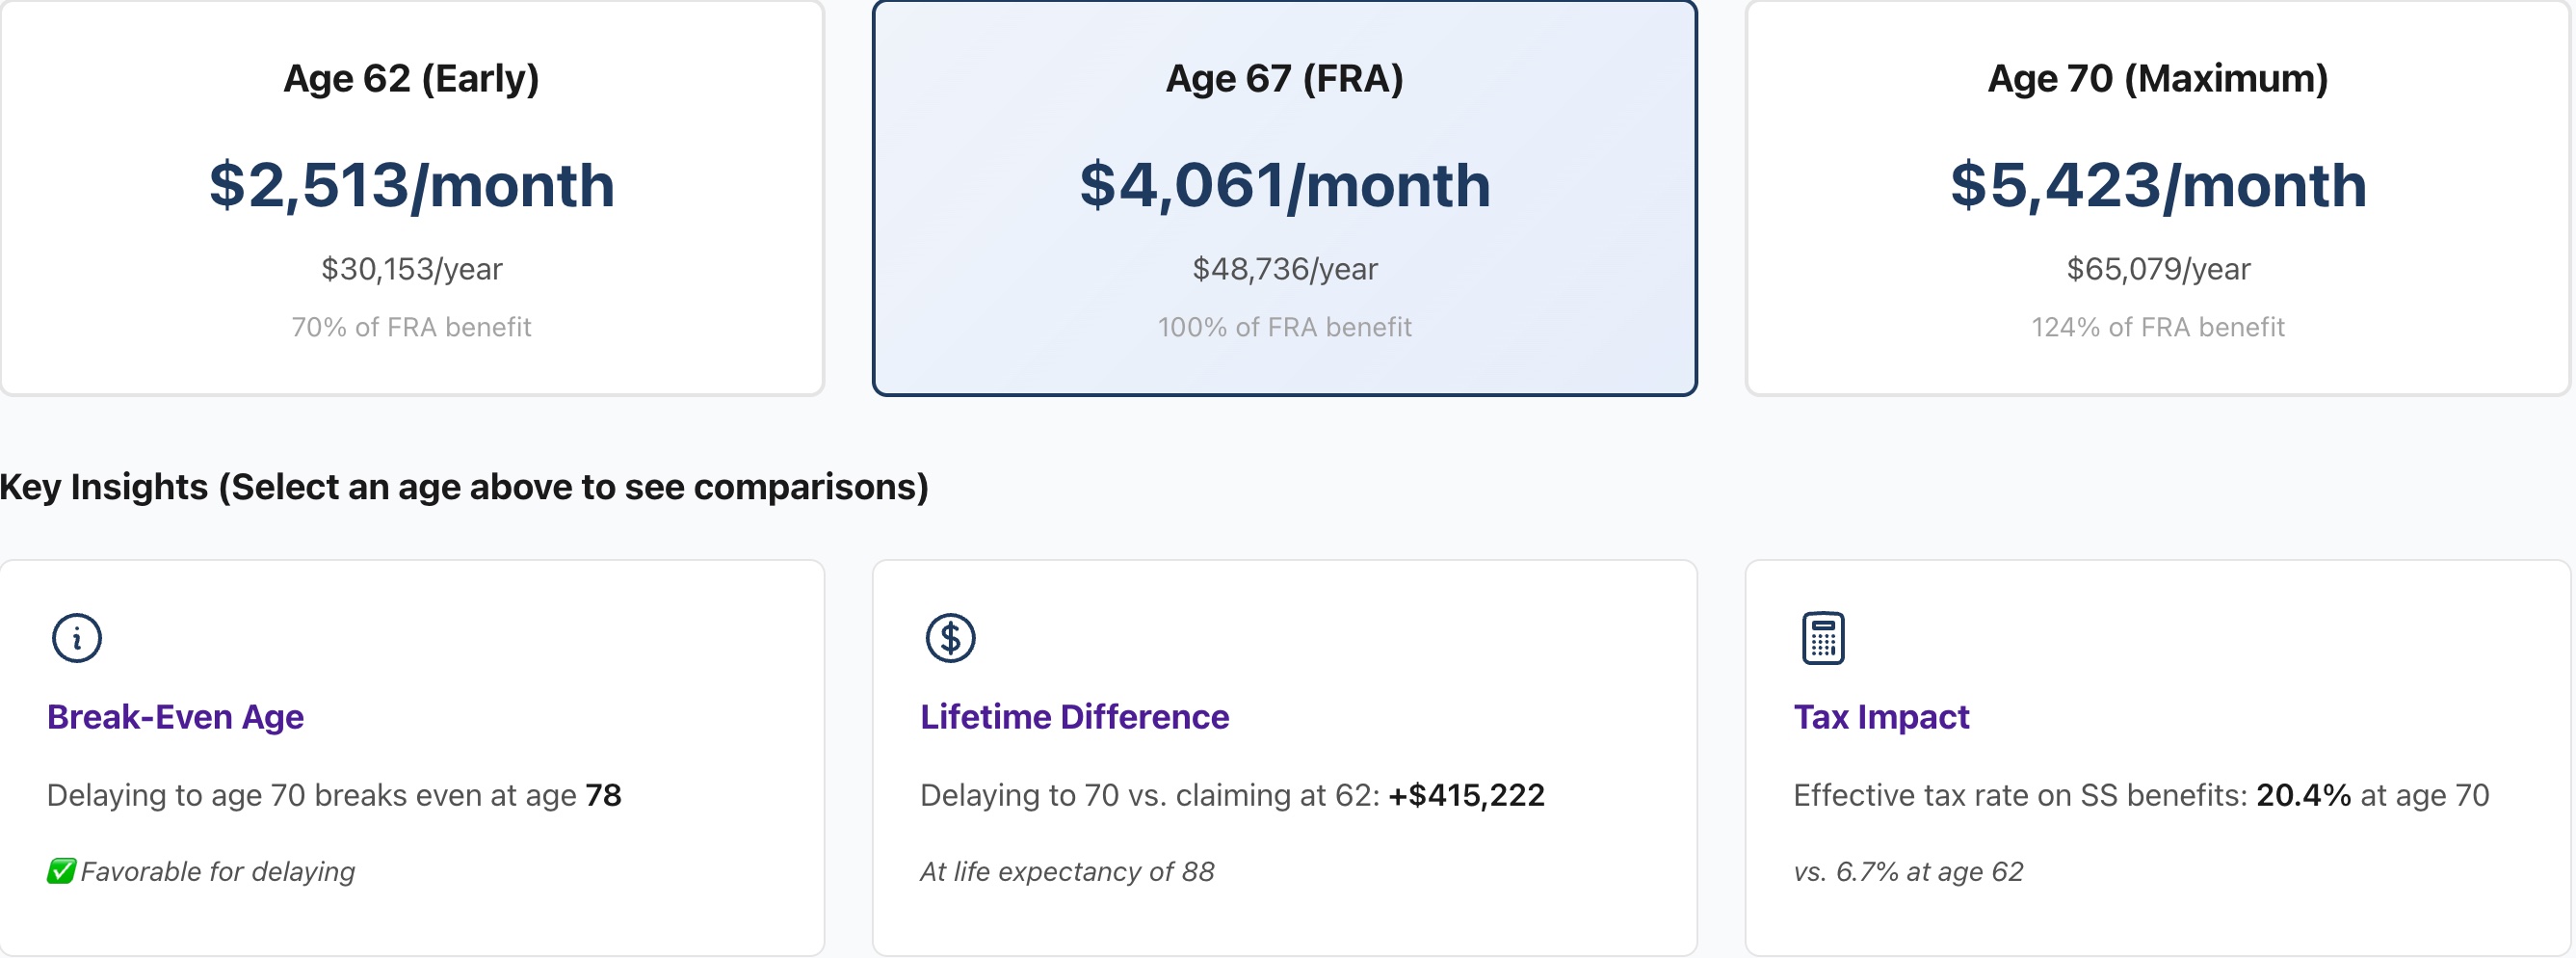
Interactive benefit cards showing monthly and annual Social Security benefits at different claiming ages, plus key insights on break-even age, lifetime difference, and tax impact
What you see: Interactive benefit cards displaying monthly and annual benefits for each claiming age. In this example, the FRA card (Age 67) is selected, showing:
- Age 62 (Early): $2,513/month ($30,153/year) - 70% of FRA benefit
- Age 67 (FRA): $4,061/month ($48,736/year) - 100% of FRA benefit
- Age 70 (Maximum): $5,423/month ($65,079/year) - 124% of FRA benefit
Key Insights displayed: Break-even age (78), lifetime difference (+$415,222 by delaying to 70), and tax impact (20.4% effective rate at age 70 vs. 6.7% at age 62).
2. Break-Even Analysis Chart
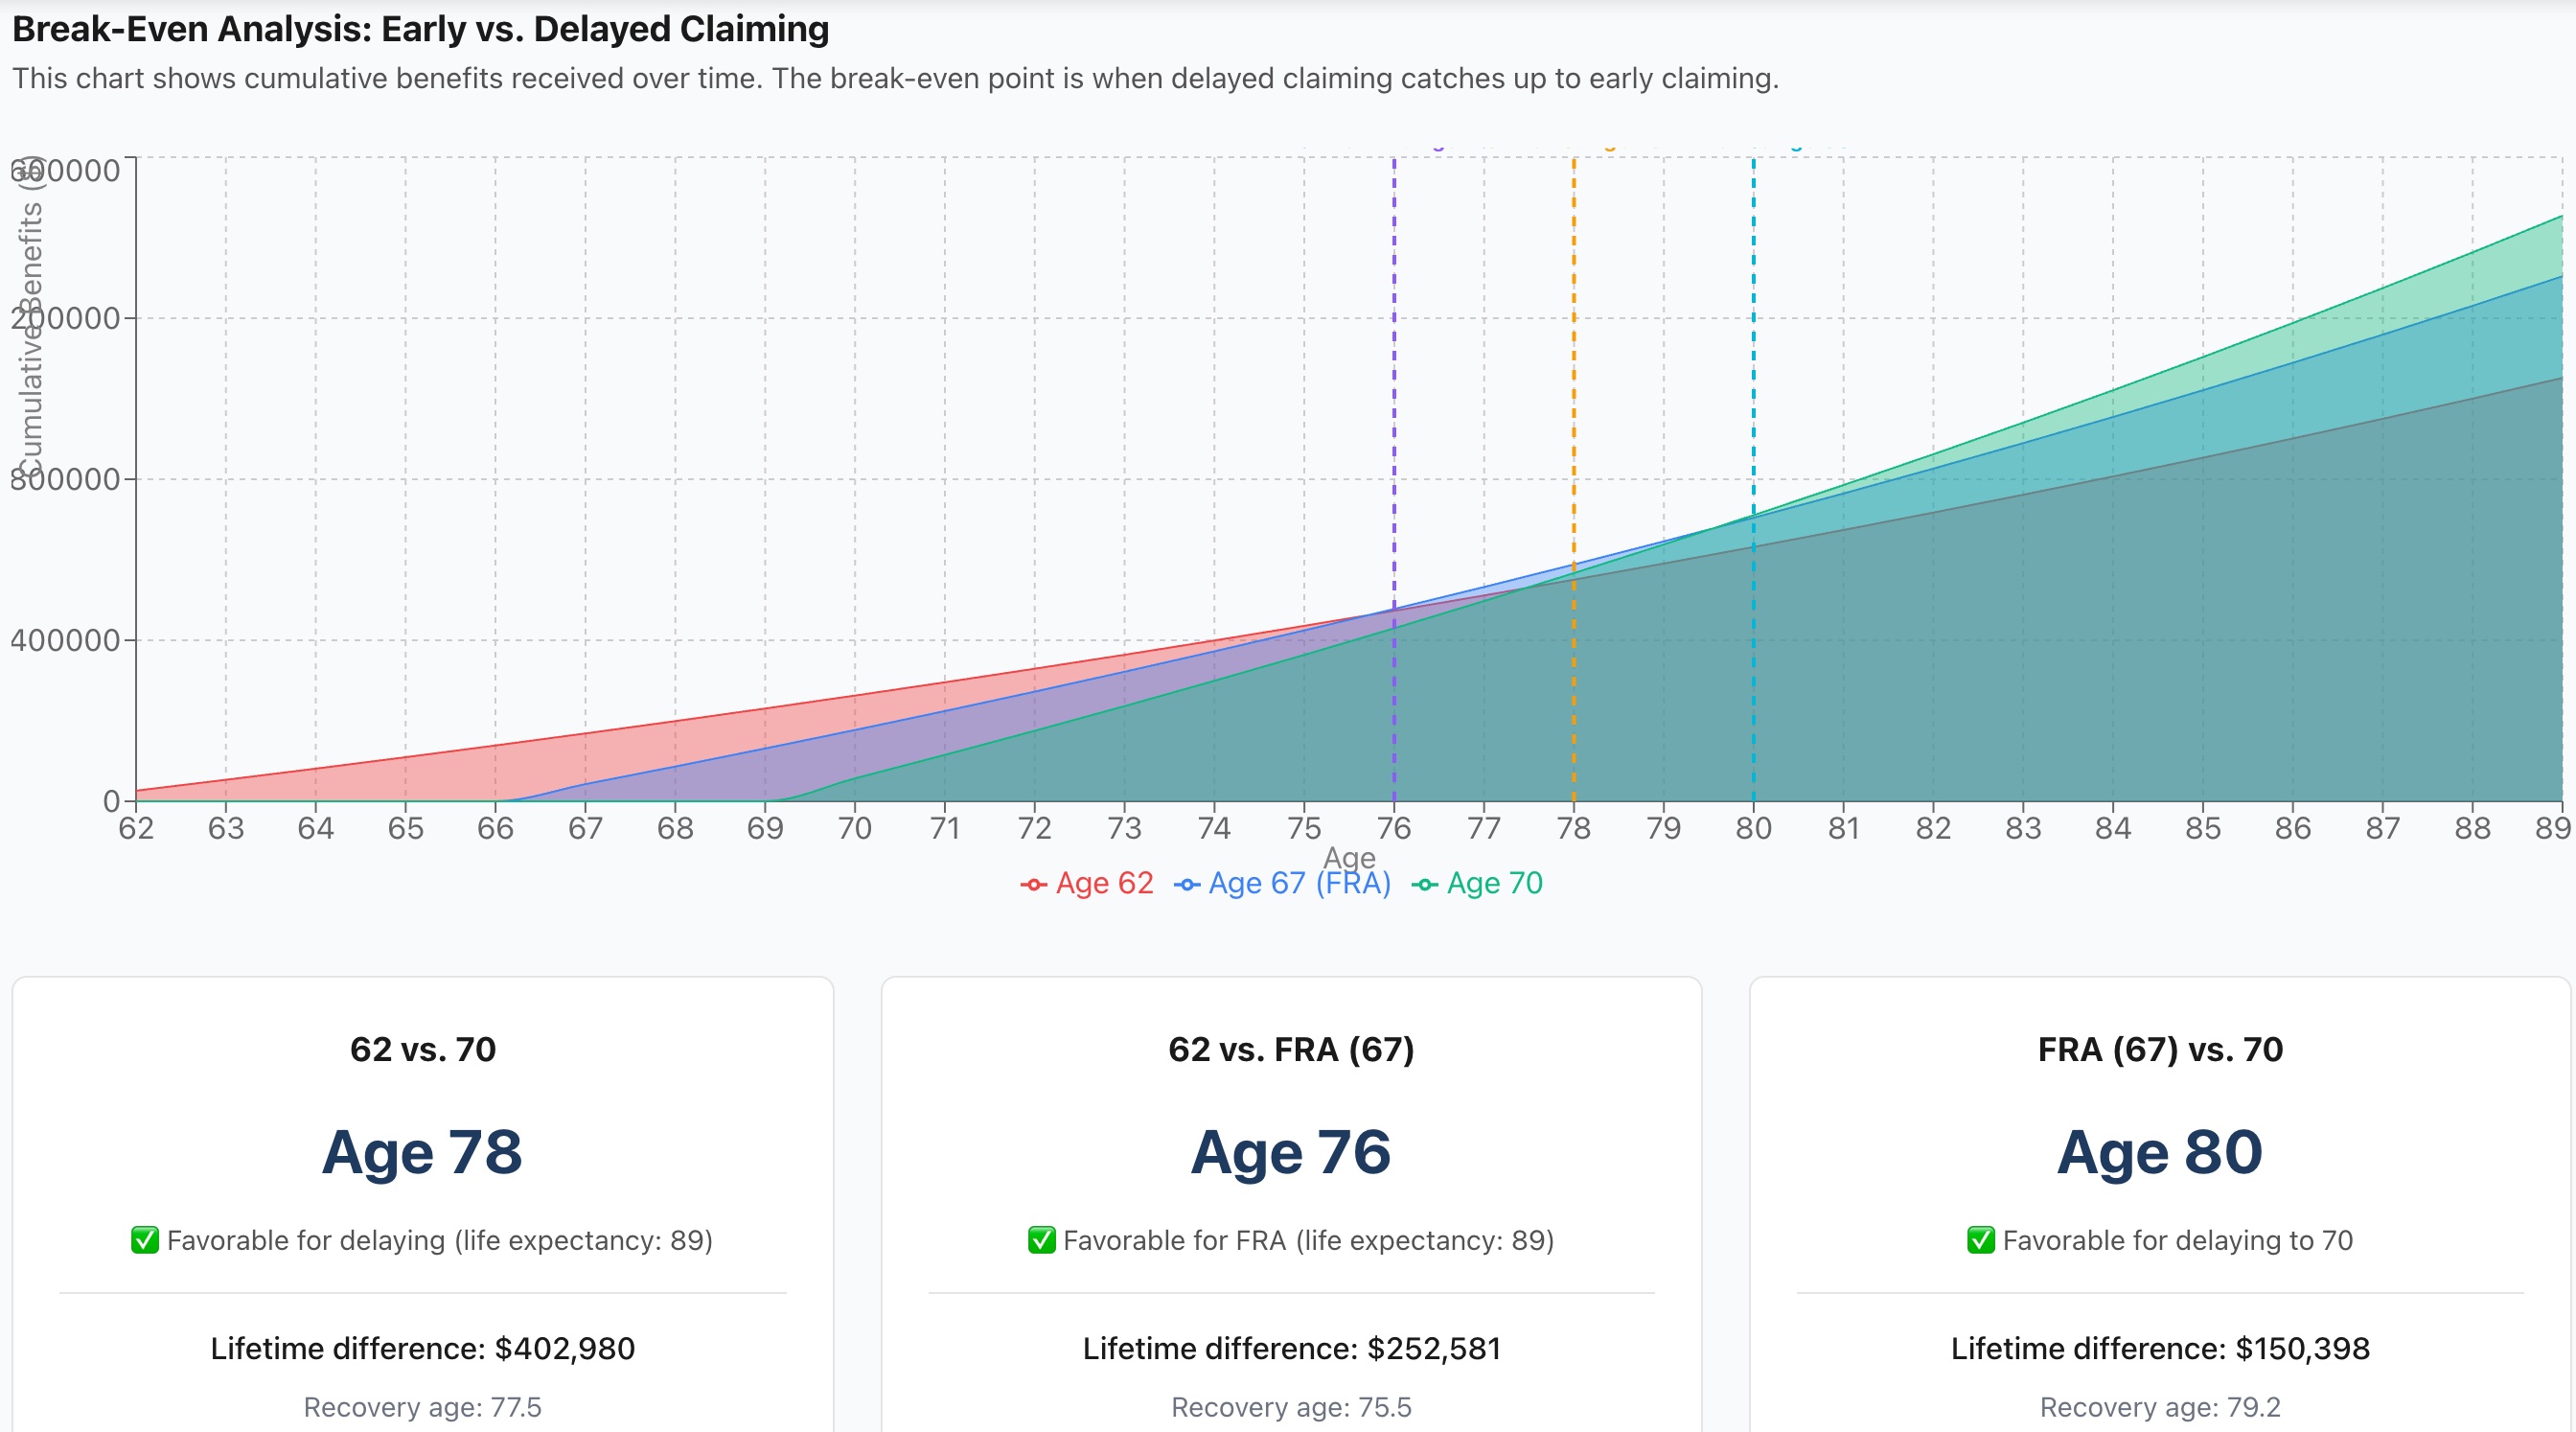
Break-even analysis showing when delayed claiming catches up to early claiming, with lifetime benefit differences for each comparison
What you see: Area chart showing cumulative lifetime benefits for each claiming age. The three colored areas represent:
- Age 62 (Red/Pink): Early claiming benefits accumulate quickly but grow slowly
- Age 67/FRA (Blue/Purple): Baseline claiming strategy
- Age 70 (Teal/Green): Delayed claiming starts later but grows faster
Break-Even Points (marked by vertical dashed lines):
- Age 76 (Purple): 62 vs. FRA break-even - FRA catches up to early claiming
- Age 78 (Orange): 62 vs. 70 break-even - Age 70 catches up to age 62
- Age 80 (Cyan): FRA vs. 70 break-even - Age 70 catches up to FRA
Lifetime Differences (at life expectancy of 88):
- 62 vs. 70: +$415,222 by delaying (additional gains after recovery: $435,998)
- 62 vs. FRA: +$263,500 by waiting to FRA (additional gains: $281,355)
- FRA vs. 70: +$151,722 by delaying to 70 (additional gains: $162,687)
✅ With a life expectancy of 88, all comparisons favor delaying—especially waiting until age 70, which provides over $400,000 more in lifetime benefits.
3. Tax Implications Dashboard
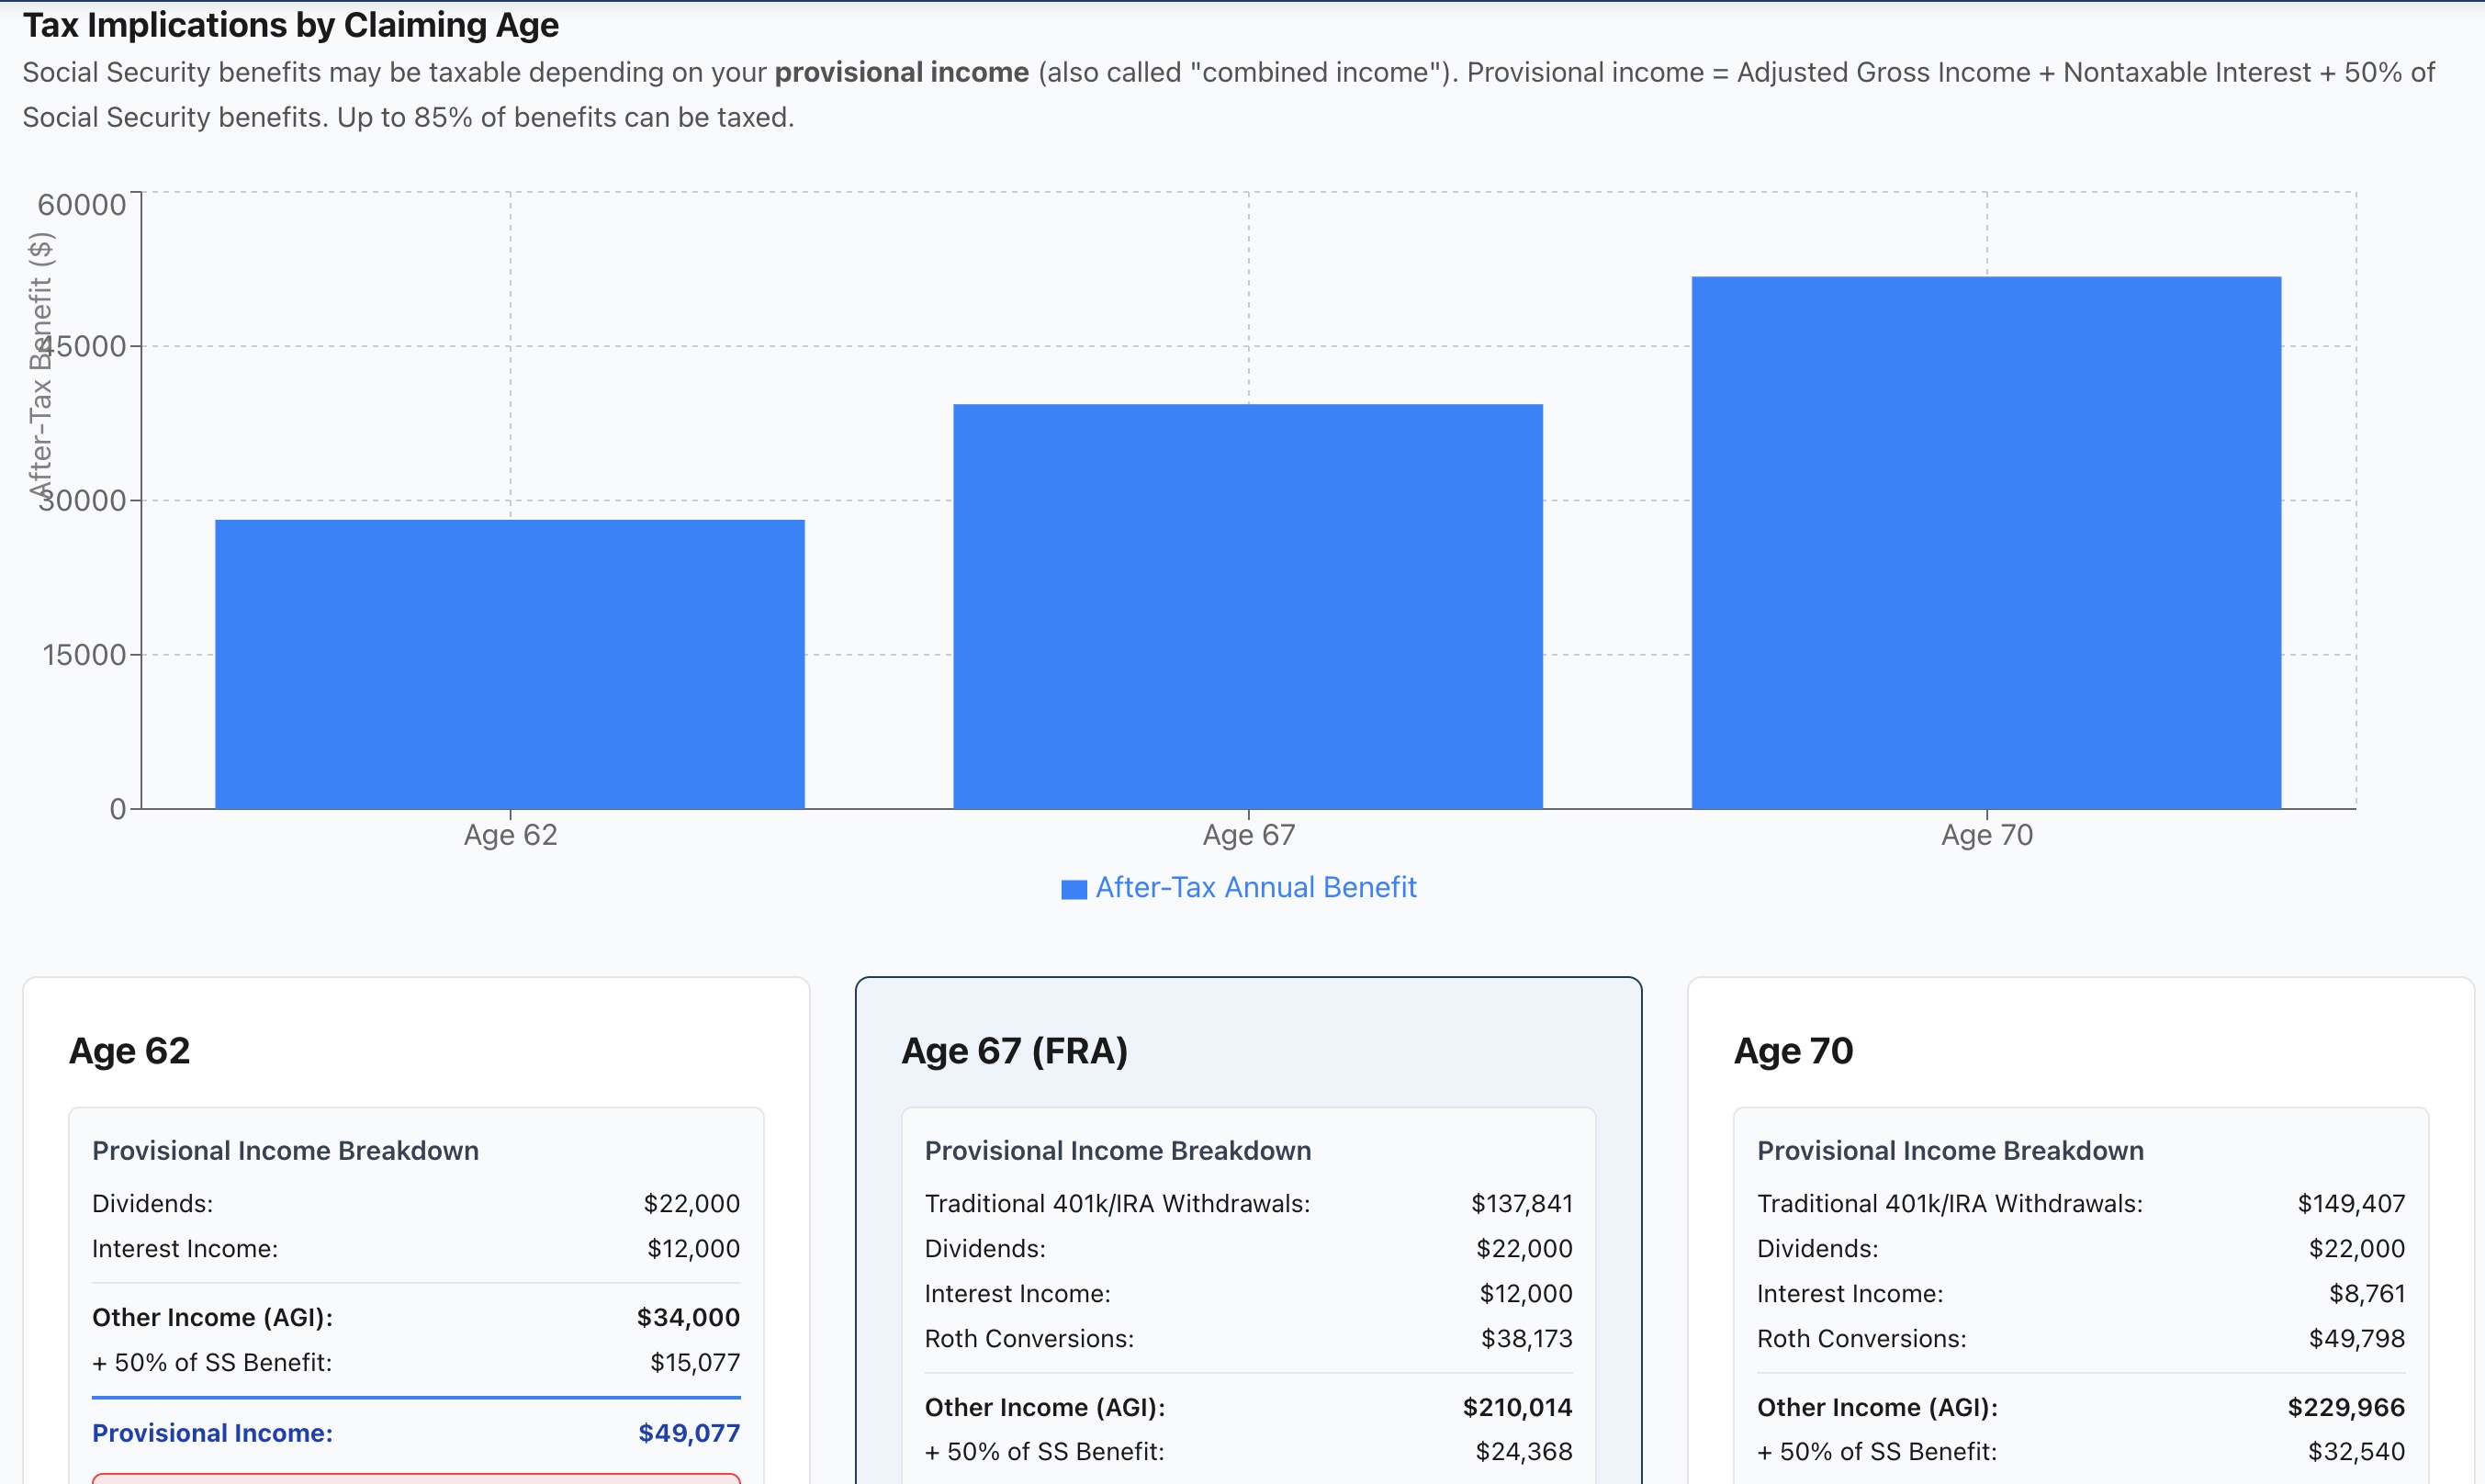
Tax implications showing after-tax annual benefits and detailed provisional income calculations for each claiming age
What you see: Comprehensive tax analysis showing how much of your Social Security benefits will be taxable based on your other income sources. The bar chart at top shows after-tax annual benefits:
- Age 62: ~$29,000/year after taxes
- Age 67 (FRA): ~$45,000/year after taxes
- Age 70: ~$56,000/year after taxes
Provisional Income Breakdown (how taxation is calculated):
Each card shows the detailed calculation of provisional income, which determines how much of your Social Security is taxable:
- Dividends + Interest Income
- Traditional 401(k)/IRA Withdrawals (increases at later ages)
- Roth Conversions (if applicable)
- Other AGI (Adjusted Gross Income)
- + 50% of Social Security Benefit
- = Provisional Income
Example from Age 67 (FRA) card:
- Traditional 401k/IRA Withdrawals: $137,841
- Dividends: $22,000
- Interest Income: $12,000
- Roth Conversions: $38,173
- Other Income (AGI): $210,014
- + 50% of SS Benefit: $24,368
- Provisional Income: $234,382
⚠️ Above threshold ($34,000) - 85% of SS taxable
All three ages exceed the threshold, meaning 85% of Social Security benefits are subject to taxation. This is why strategic income planning is critical.
💡 Key Insight: Even though 85% of benefits are taxable at all ages, delaying to 70 still provides significantly higher after-tax income ($56K vs. $29K at age 62)—nearly double the after-tax benefit!
💡 Interactive & Personalized
Unlike static calculators, the analysis updates in real time as you adjust your profile, health factors, or retirement goals. Every number is calculated based on your specific situation—not averages or generic assumptions. The tool also includes opportunity cost analysis and advanced strategies for spousal coordination, tax analysis, and portfolio integration.
Why Personalized Analysis Matters
Retirement planning isn't one-size-fits-all. Traditional calculators provide generic estimates based on averages, but they don't account for your unique situation. Social Security analysis in a Praxion plan:
- ✓ Models lifetime benefits: Not just monthly payments
- ✓ Accounts for taxes: Shows after-tax income, not just gross benefits
- ✓ Integrates with investments: Coordinates with your portfolio and withdrawal strategies
- ✓ Models opportunity cost: Shows trade-offs transparently
- ✓ Provides actionable insights: Clear analysis, not just data dumps
- ✓ Considers spousal strategies: Evaluates spousal and survivor benefits and claiming coordination
Whether you're considering early retirement, planning around your spouse's benefits, or evaluating investment strategies alongside Social Security, our tool provides the clarity you need to make confident decisions.
Frequently Asked Questions
How much Social Security will I get at 62 vs 70?
If your full retirement age is 67, claiming at 62 pays about 70% of your full benefit and waiting until 70 pays about 124%. The estimator above shows the monthly amount at each age from your birth year and earnings.
When should I claim Social Security benefits?
The right age depends on your situation. Claiming early at 62 gives immediate income but reduces monthly benefits by up to 30%. Waiting until Full Retirement Age (typically 67) gives 100% of benefits. Delaying until 70 increases benefits by 8% per year. Taxes, investments, health, and life expectancy all influence the timing.
How are Social Security benefits taxed?
Up to 85% of Social Security benefits may be taxable depending on your provisional income (AGI + nontaxable interest + 50% of SS benefits). For single filers: 0% taxable if income < $25,000, 50% if $25,000-$34,000, 85% if > $34,000. For married filing jointly: 0% if < $32,000, 50% if $32,000-$44,000, 85% if > $44,000.
How can I maximize my Social Security benefits?
Compare claiming ages alongside your taxes, savings, and your spouse's benefits rather than in isolation. Delaying benefits, managing taxable income, and coordinating with spouse benefits can all increase lifetime value.
Can I combine Social Security with my retirement investments?
Yes! Advanced scenario planning in Praxion Finance allows you to model Social Security alongside investments to model total retirement income. This includes evaluating the opportunity cost of delaying benefits while drawing down investments, and coordinating claiming timing with Roth conversions and other tax strategies.
Is there a free tool to analyze my Social Security options?
Yes. The estimator on this page shows your monthly benefit at 62, full retirement age, and 70. For break-even ages and a side-by-side comparison of claiming ages, use Praxion's free Social Security analyzer and break-even calculator.
What Your Praxion Plan Adds
Build a free Praxion plan to see:
- A modeled preferred claiming age based on your life expectancy and goals
- Potential lifetime benefit differences between claiming strategies
- How taxes and opportunity costs affect your retirement income
- Coordination with your investment portfolio and withdrawal strategy
- Break-even analysis and scenario comparisons
Make informed decisions today to secure a financially confident tomorrow.
See Your Claiming Ages in Your Plan
See your personalized claiming strategy with tax-adjusted benefits, break-even analysis, and opportunity cost modeling—all integrated with your complete retirement plan.
No credit card required • Full retirement planning included
Praxion Finance is a decision-support tool, not a registered investment adviser.
Note: This article was drafted with AI assistance and reviewed by Praxion Finance experts. Educational purposes only.