Executive Overview
Under current law, Social Security's retirement trust fund is projected to be depleted around 2032–2033. If no legislative changes occur, benefits would automatically be limited to incoming payroll tax revenue, resulting in an across-the-board benefit reduction of roughly 23–25%.
For many retirees, that's not a marginal adjustment—it's a structural break in their retirement income plan.
This article goes beyond headlines to answer a more practical question:
What does a Social Security cut actually do to a real retirement plan—in dollars, cash flow, and portfolio risk?
1. What "Insolvency" Actually Means (and What It Doesn't)
Social Security does not "run out of money" in the conventional sense.
When the Old-Age and Survivors Insurance (OASI) trust fund is depleted:
- Payroll taxes continue to flow
- Benefits continue to be paid
- Payments are capped at what current revenue supports
Today's projections indicate that post-depletion revenue would cover roughly three-quarters of scheduled benefits.
Unless Congress acts, benefit reductions are automatic, immediate, and apply to all beneficiaries, including those already retired.
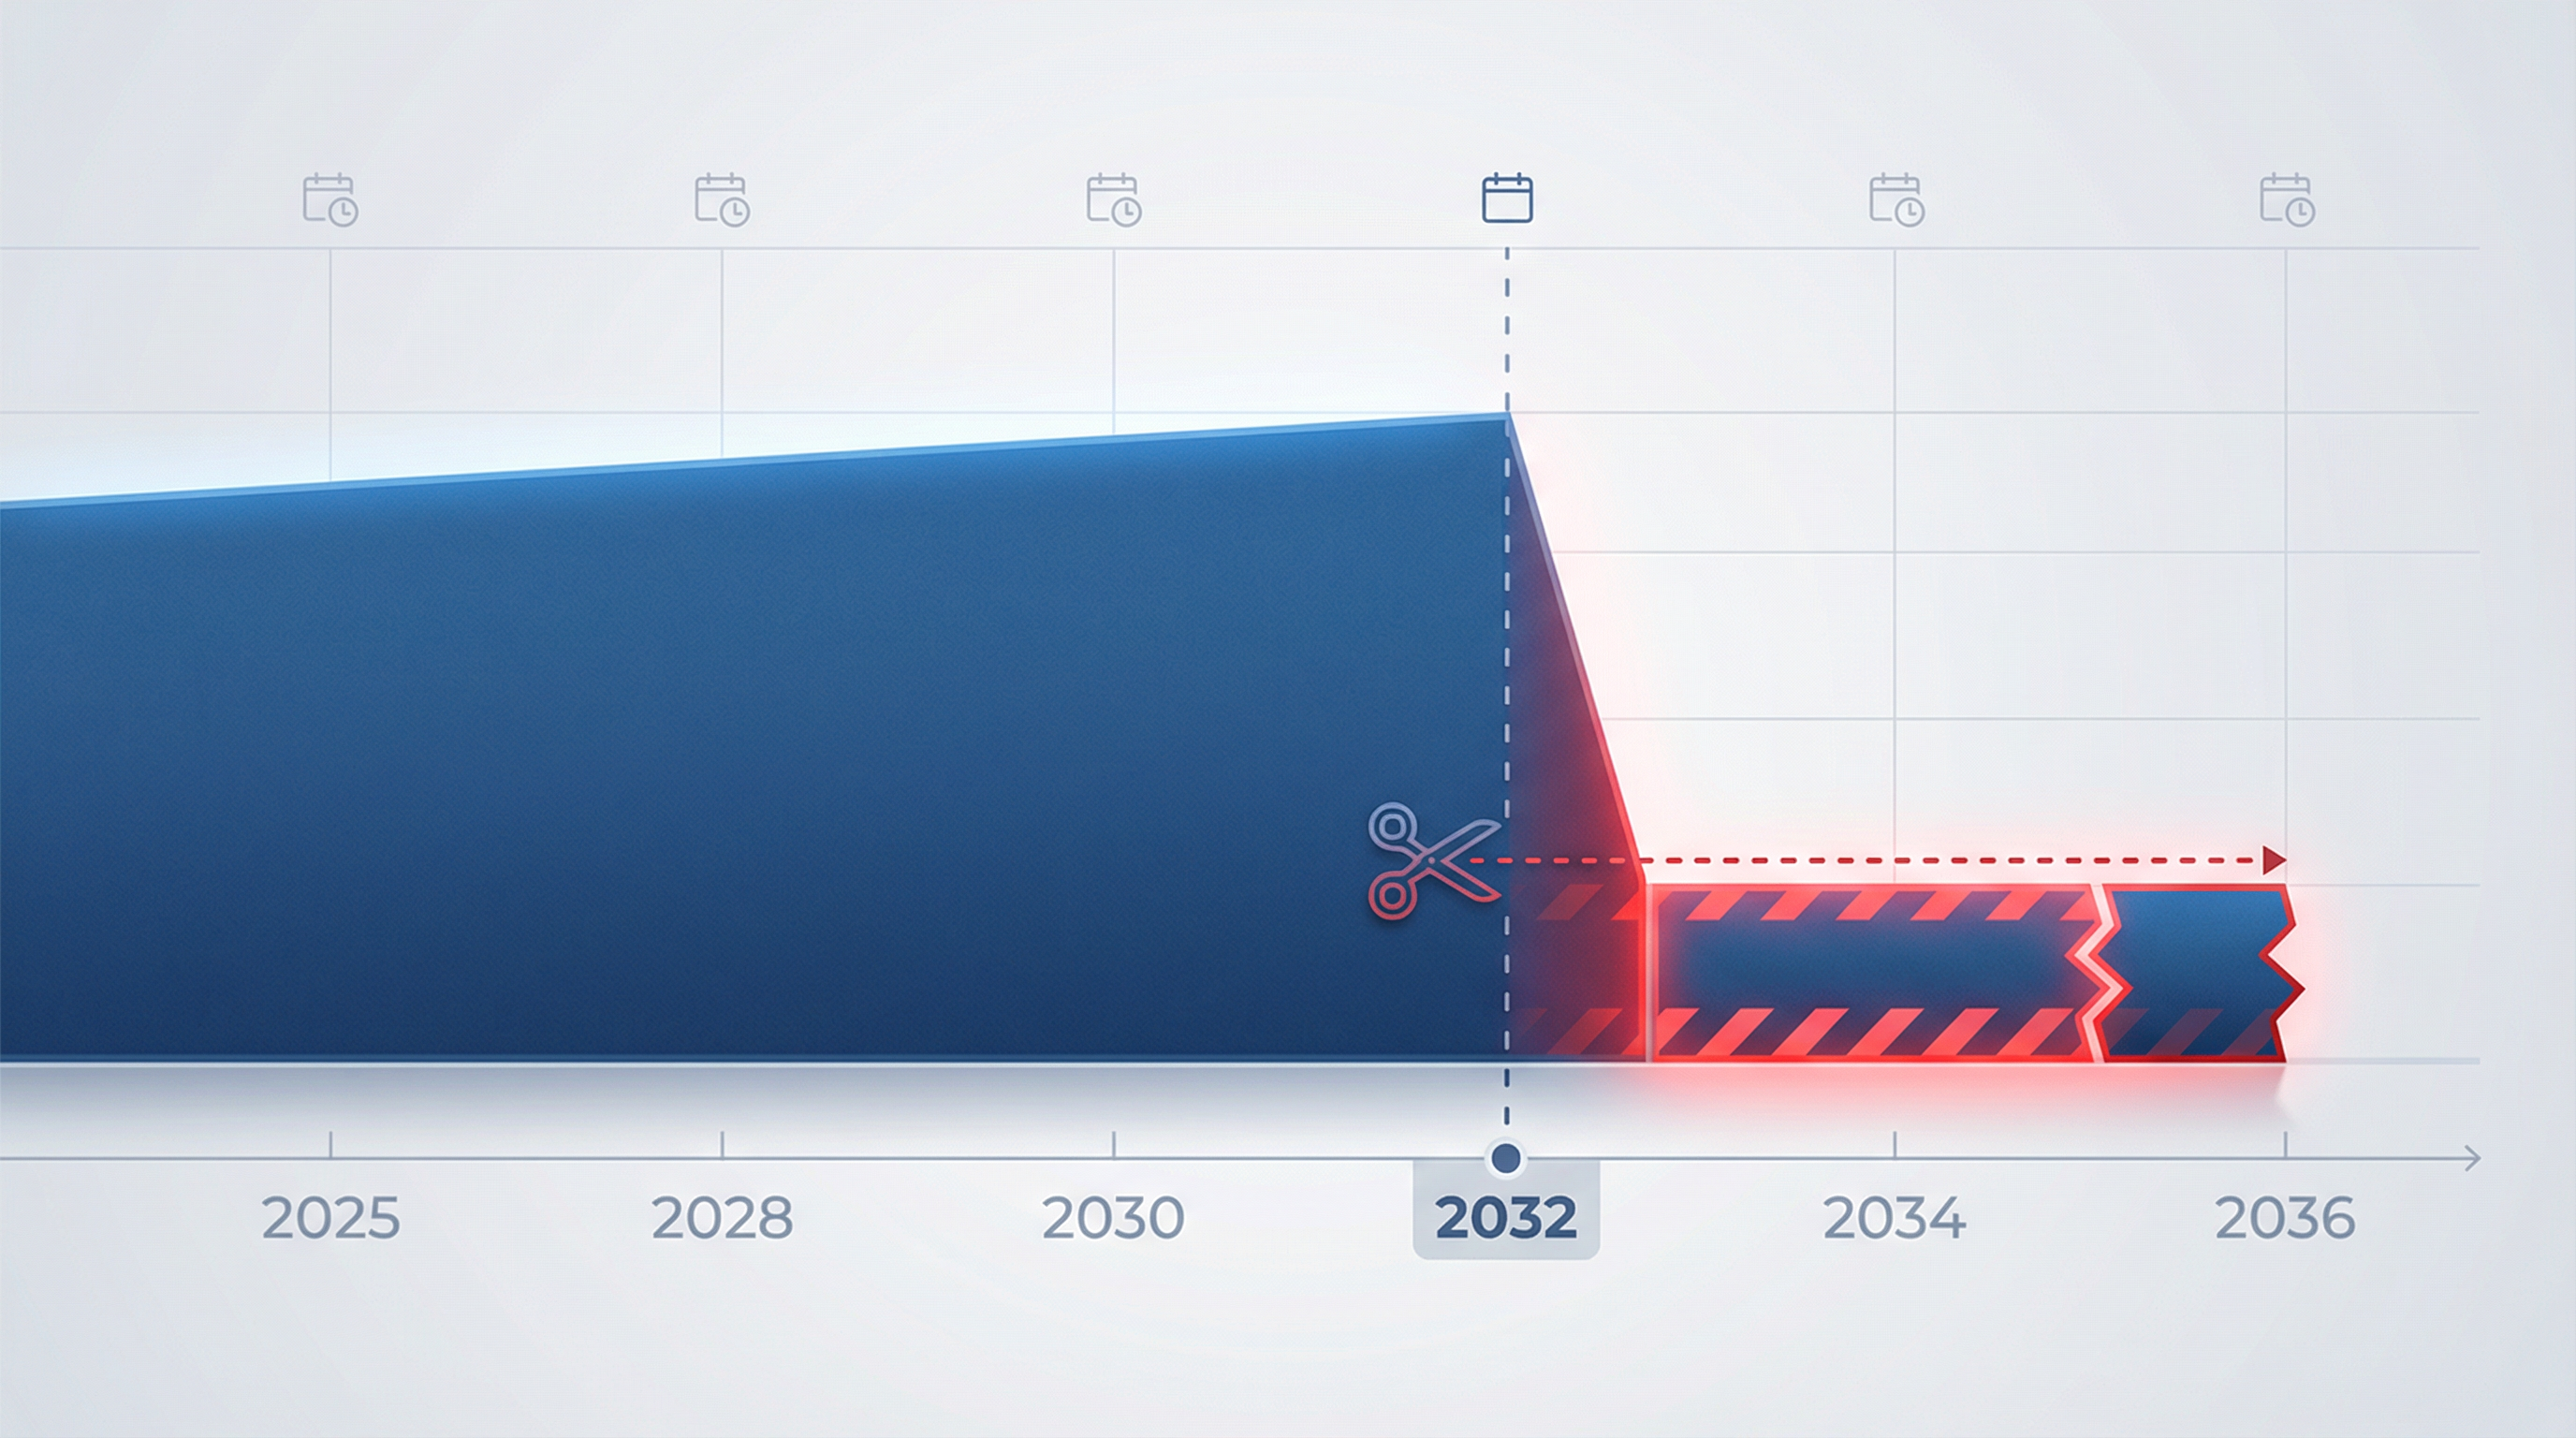
A Social Security cut doesn't happen gradually—it creates a visible break in retirement income.
Figure: Scheduled Social Security benefits versus projected benefits under current law if a cut begins in 2032. Assumes $3,200/month at Full Retirement Age (67) with 2.5% annual COLA adjustments.
Want to see this using your own Social Security estimate?
Model this scenario in your retirement plan →2. Modeling Assumptions Used in This Analysis
To keep the analysis transparent and conservative, we use assumptions consistent with mainstream retirement planning:
| Assumption | Value |
|---|---|
| Trust fund depletion year | 2032 |
| Benefit reduction | 24% |
| Inflation (long-term) | 2.5% |
| Real portfolio return | 4.0% |
| Safe withdrawal reference | 4% |
| Retirement duration | 25 years |
| Claiming age | 67 |
These assumptions are not predictions—they are stress-test inputs.
3. Scenario 1: Near-Retiree (Age 60 Today)
Baseline Social Security
Expected benefit at 67: $3,200/month
Annual income:
Post-2032 Reduced Benefit
Annual Income Loss
Lifetime Impact (25-Year Retirement)
That's $230,000 in lost guaranteed income, before considering inflation compounding or longevity beyond 25 years.
Portfolio Impact Translation
To sustainably replace $9,216 per year:
A Social Security cut of this size requires an additional ~$230K in retirement assets just to maintain the same spending level.
What Does This Cut Really Cost You?
The cumulative impact grows significantly over time. Here's how much money you lose over your lifetime:
Figure: Cumulative lifetime Social Security income loss if benefits are cut in 2032. The line steepens with age, making longevity risk obvious.
4. Scenario 2: Already Retired Couple (Age 70 in 2032)
This is where risk compounds.
| Item | Amount |
|---|---|
| Current Benefit | |
| Monthly | $3,600 |
| Annual | $43,200 |
| Reduced Benefit | 43,200 × 0.76 = $32,832 |
| Annual Loss | $10,368 |
Why This Scenario Is More Dangerous
Already-retired households:
- Are actively withdrawing from portfolios
- Have limited earning flexibility
- Face rising healthcare and insurance costs
To offset the cut:
That additional withdrawal pressure materially increases longevity risk.
5. Scenario 3: Single Retiree Heavily Reliant on Social Security
Assume:
- Monthly benefit: $2,000
- Annual: $24,000
- Social Security = 60% of total income
| Calculation | Amount |
|---|---|
| Reduced Benefit | 24,000 × 0.76 = $18,240 |
| Annual Shortfall | $5,760 |
Lifestyle Impact
If SS is 60% of income:
That's a $9,600 annual spending adjustment
unless offset by savings or work.
Annual Spending Gap Created by the Cut
The Social Security cut creates a persistent gap between desired spending and available income. Here's how much spending must be reduced or funded elsewhere:
Figure: Additional annual spending gap created by the Social Security cut. This shows the difference between income under Full Benefits vs. each cut scenario. Full Benefits (100%) shows zero gap, while Partial Fix (90%) and 2032 Cut (76%) show increasing gaps.
6. The Second-Order Effects Most Plans Miss
A Social Security cut doesn't just reduce income—it triggers a chain reaction:
- Higher portfolio withdrawals
- Increased sequence-of-returns risk
- Faster depletion of tax-deferred accounts
- Higher marginal tax exposure
- Reduced flexibility for healthcare shocks
Over a long retirement, this compounding effect can add $300,000–$500,000 of stress to a plan.
7. Planning With Explicit Social Security Scenarios
A resilient retirement plan should model multiple futures, not a single promise:
Full legislative fix
Best-case scenario: Congress acts to maintain full benefits
Partial fix
Moderate scenario: Some benefit reduction but less severe
Current law stress test
Stress test: No legislative action, automatic reduction
Use the 76% scenario as a stress test, not a forecast.
Conclusion
A potential Social Security benefit cut in 2032 isn't just a political issue—it's a quantifiable risk that can materially impact retirement plans. By modeling multiple scenarios and understanding the dollar impact on your specific situation, you can build a more resilient retirement plan that accounts for this possibility.
The key is to stress-test your plan with a 76% Social Security scenario, understand the portfolio impact, and adjust your savings or spending expectations accordingly. This quantitative approach removes the emotion from the headlines and gives you actionable data to make informed decisions.
Sources and References
All facts, claims, and assumptions used in this analysis are sourced from authoritative government and research institutions:
| Fact / Claim | Source | Link |
|---|---|---|
| Social Security trust fund projected depletion ~2032–2033 | Social Security Administration, 2025 Trustees Report | SSA Trustees Report |
| Social Security replacement rate ~75% post-depletion | Congressional Budget Office, Social Security Projections | CBO Social Security Analysis |
| Average retired worker benefit (2025) | SSA Monthly Statistical Snapshot | SSA Fact Sheets |
| Married couple average benefits estimate | SSA Monthly Statistical Snapshot | SSA Fact Sheets |
| COLA for 2026: 2.8% | SSA COLA Announcements | SSA COLA |
| Retiree reliance on Social Security (62–78%) | AARP Retirement Survey | AARP Research - Economics |
| Safe withdrawal rate for retirement planning: 4% | Bengen, William, 1994 | Financial Planning Association |
| Real portfolio return assumption: 4% | Vanguard / Morningstar Historical Data | Vanguard Investor Resources |