Savings Tracker: A Complete Guide to Retirement Readiness
How Praxion uses three industry benchmarks to score whether your modeled plan is on track — and what to do if it isn't.
What the Savings Tracker Does
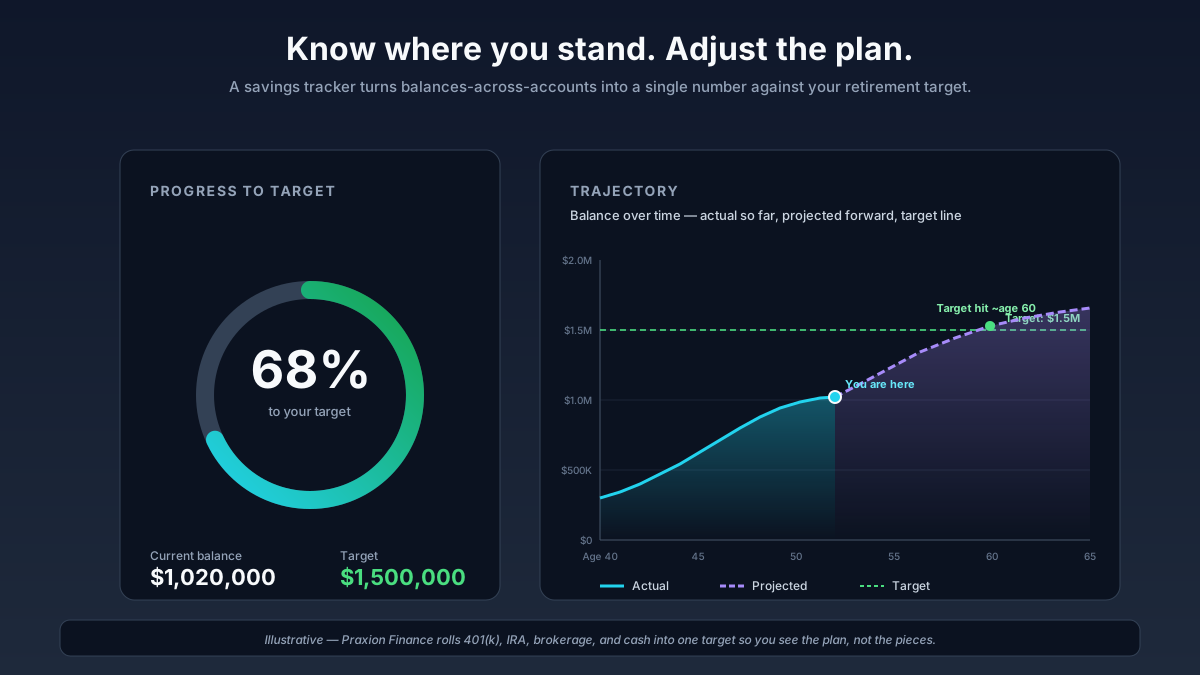
The Savings Tracker is a built-in dashboard tool that answers a single, important question: is the modeled retirement plan on track? It produces one 0–100 Readiness Score, a per-benchmark breakdown, and a personalized action plan with specific dollar amounts.
It is not a forecast. It is a gap analysis against three widely-used industry benchmarks — T. Rowe Price's age-based salary multiples, Fidelity's 15% savings-rate rule, and the 10–12× final-salary target. Combined, they answer four practical questions:
- Is the modeled trajectory on track to meet the retirement goal?
- How much has been saved so far?
- What percentage of the goal has been achieved?
- How is the savings rate affecting progress?
If you have never opened it, this guide is the bridge: read this first, then open the Savings Tracker with full context for what each number means.
The Three Industry Benchmarks Behind the Tool
Before you can read your Readiness Score, it helps to know the three benchmarks the score is built on. They come from different sources and answer different questions, and the tool combines them into a single picture of readiness.
1. T. Rowe Price age-based salary multiples
At each age, your retirement savings should equal a multiple of your salary. The Praxion tool uses T. Rowe Price's published benchmark table:
| Age | Min (× salary) | Max (× salary) |
|---|---|---|
| 25 | 0.0× | 0.5× |
| 30 | 0.5× | 1.0× |
| 35 | 1.0× | 2.0× |
| 40 | 1.5× | 2.5× |
| 45 | 2.0× | 3.5× |
| 50 | 2.5× | 4.0× |
| 55 | 3.5× | 5.5× |
| 60 | 4.5× | 8.0× |
| 65 | 6.0× | 11.0× |
| 67 | 7.5× | 13.5× |
For ages between benchmark rows (say age 32, between the 30 and 35 entries), the tool linearly interpolates so the target moves smoothly from year to year rather than jumping at every birthday. The card you see in the Savings Tracker reports your status against this range as Excellent (savings at or above the max), Good (above the midpoint), On Track (above the minimum), or Behind (below the minimum).
2. The Fidelity 15% Savings Rate Rule
Fidelity's widely-cited rule of thumb: save at least 15% of pre-tax income annually, including employer match. The rule assumes roughly 45% of retirement income comes from personal savings and the rest from Social Security.
Important nuance the tool adds: 15% is calibrated for someone with about 20–29 working years remaining. The Praxion Savings Tracker age-adjusts this number, scaling the target up or down based on how much time you have left and how close you already are to your age benchmark. We unpack the ladder in section 4 below — it is the most useful nuance most consumer articles miss.
3. The 10–12× Final-Salary Rule
By the time you retire, your portfolio should be roughly 10–12 times your final annual salary. That target supports a 4–5% annual withdrawal rate while preserving principal — the same logic that powers the more famous "4% rule". For the withdrawal-side companion, see The 4% Rule Explained.
Your Readiness Score, Explained
The 0–100 Readiness Score is the headline number in the tool. It is a weighted blend of two of the benchmarks above:
- 60% from the T. Rowe Price savings-position score (how your current balance compares to your age benchmark).
- 40% from the Fidelity contribution-rate score (how your current savings rate compares to the age-adjusted target).
The weighting reflects a practical truth: what you have already saved matters more than what you are saving right now — but both count.
Bracket thresholds
| Score | Rating | Color | Plain-English meaning |
|---|---|---|---|
| 90–100 | Excellent | Green | The modeled plan looks strong for retirement. |
| 75–89 | Good | Blue | On track relative to the modeled targets. |
| 60–74 | Fair | Yellow | Consider increasing contributions. |
| 0–59 | Needs Improvement | Red | Time to boost retirement savings in the model. |
If you are already retired, the math shifts. The tool drops the contribution-rate input (it no longer applies) and assesses readiness against the 25× annual expenses rule — the Trinity-study cousin of the 4% rule — plus a plan-solvency check from the live projection engine. A retired user with ample savings still scores well; a retired user whose plan shows insolvent years gets a low score regardless of cash on hand.
Want your own score?
The Savings Tracker pulls your profile and computes the score in a few seconds. Open the Savings Tracker.
How the Tool Decides You're "On Track" or "Behind"
This is the deepest section of the tool, and the most useful one to understand. The 15% Fidelity rule is a baseline. The Savings Tracker scales the target up or down based on how many working years you have left and how close you are to your age-based T. Rowe Price benchmark.
Step 1: base rate by working years remaining
| Working years remaining | Base savings target |
|---|---|
| 30+ | 12% |
| 20–29 | 15% (the Fidelity standard) |
| 15–19 | 18% |
| 10–14 | 22% |
| 5–9 | 28% |
| 2–4 | 35% |
| 1 | 45% |
| < 1 | 50% (capped) |
The intuition: someone with 30+ years to invest can lean on compound growth and get away with a smaller percentage of income; someone with 5 years to retirement has to do the heavy lifting in cash today.
Step 2: adjust for where you stand vs. your age benchmark
The base rate is then multiplied by an adjustment factor based on your current savings position relative to the T. Rowe Price midpoint:
- More than 30% behind the age benchmark → ×1.5 (aggressive catch-up)
- 15–30% behind → ×1.3
- Within 15% (either side) → ×1.1
- 15–30% ahead → ×0.85
- More than 30% ahead → ×0.7
The final adjusted rate is capped at 50%, so the tool never recommends saving more than half your income, no matter how far behind you are.
Status thresholds for the Fidelity card
Once the tool has your age-adjusted target, it grades your actual savings rate against it:
- Rate ≥ 1.2× the target → Excellent
- Rate ≥ 1.0× the target → Good / On Track
- Rate ≥ 0.75× the target → Fair
- Rate below 0.75× the target → Behind
Translation: a 28-year-old earning $80k can hit "Good" at a 12% savings rate. A 55-year-old at the same income probably needs to hit 28% — and more if they are also behind their age benchmark.
What Counts as "Retirement Savings"?
People often misread their score because the tool counts a different set of accounts than they assume. Here is the exact list.
Counted toward retirement savings
- Traditional 401(k)
- Roth 401(k)
- Traditional IRA
- Roth IRA
- HSA (Health Savings Account)
- Brokerage / taxable investment account
- All of the above for the spouse, when modeled as married
Not counted
- Cash and emergency fund — intentionally excluded; the tool reasons about cash elsewhere and does not double-count it as retirement savings.
- Home equity, business equity, collectibles, and other illiquid assets are out of scope.
Annual contributions include the employer 401(k) match (per Fidelity's own definition of the 15% rule), HSA employer contribution, and any modeled surplus that flows to investment accounts in the projection — not just what you write into the contribution fields.
The tool also runs an anomaly check: if your total savings is less than 50% of the T. Rowe Price minimum for your age, it surfaces a prompt asking "Is a retirement account missing from the profile?" This catches the most common cause of a surprisingly low score — a forgotten Roth IRA or HSA. If you see it, walk through your accounts in the profile editor before reacting to the score.
Reading Your Personalized Action Plan
When the score is below Excellent, the tool generates between zero and four recommendations, each with a priority (High, Medium, or Low) and a specific dollar amount. There are four recommendation types:
- Close the Savings Gap (High priority) — fires when your total savings is below the T. Rowe Price minimum for your age. The required monthly contribution is computed using the standard PMT formula over a 5-year catch-up window, assuming a default 7% annual investment return. This is more accurate than a naive "gap divided by months" because it accounts for compounding while you contribute.
- Boost the Savings Rate (High or Medium) — fires when your contribution rate is below the age-adjusted Fidelity target. Tells you the dollar amount to add per month to hit the target.
- Maximize the 401(k) (Medium) — fires when your employee 401(k) deferrals are below the IRS limit. Catch-up contributions are automatically included for age 50 and up. The tool quotes the limit for the current calendar year — it always uses today's IRS caps, so the recommendation never goes stale.
- Open or Max Out the Roth IRA (Medium) — fires when no Roth IRA is modeled for you, or contributions are below the IRS limit. Same dynamic-limit treatment as the 401(k) recommendation.
For users already past their retirement age, the 401(k) and Roth IRA recommendations are skipped entirely. The tool focuses retirees on the withdrawal side of the plan instead.
A quick example. Suppose a 45-year-old with $150,000 saved is $100,000 behind the T. Rowe Price minimum for their age. A naive split says "you need an extra $1,667 per month for 60 months" ($100,000 ÷ 60). The tool's PMT-based math says about $1,400 per month, because the contributions you make in years 1–4 will themselves compound over the catch-up window. Same gap, less cash out of pocket each month. That is the kind of detail the tool exists to surface.
See your action plan
The tool will tell you which of the four recommendations apply to your profile and the exact dollar amounts. Open the Savings Tracker.
Common Questions
How much should I have saved by a given age?
Quick midpoint shortcuts from the T. Rowe Price table: roughly 1× salary by 30, 3× by 40, 6× by 50, 8× by 60, and 10× by 67. The live tool uses the full min/max range rather than a single midpoint, so do not be alarmed if you are not exactly on these numbers — the "On Track" band is wider than that.
What if I am behind schedule?
Read the action plan. If you are 50 or older, IRS catch-up contributions kick in for both 401(k) and IRA accounts. The Savings Tracker resolves the current year's IRS caps automatically, so the dollar amounts in your action plan are always current. Other levers: work one or two more years, or model a slightly lower retirement spending number.
Should all accounts be tracked together?
Yes — the tool already aggregates 401(k), Roth 401(k), Traditional IRA, Roth IRA, HSA, and brokerage balances (plus spouse equivalents). Cash and emergency funds are kept separate intentionally so they do not inflate the score.
How often should I check progress?
Quarterly is plenty. Annual is fine for most households. Checking more often during market volatility tends to add stress without changing decisions. The score moves slowly because most of its inputs do.
What matters more — the amount saved or the savings rate?
Early in a career, the savings rate dominates because compound interest has decades to work. Later, the total amount dominates because the balance is large enough that contributions barely move the needle. The Readiness Score weights this at 60% saved / 40% rate to reflect that balance.
Open the Savings Tracker
The Savings Tracker turns three industry benchmarks into one readiness score and a concrete action plan. Open it to see your numbers.