Am I on Track to Retire? A Self-Assessment for Ages 50–65
Use age-specific benchmarks and a 5-question self-assessment to find out where you actually stand — and what to do next.
Who this article is for
Ages 45–65 within 1–15 years of a planned retirement, with most savings in 401(k) / IRA accounts, who want a specific answer to “am I behind, and by how much?” — not another generic checklist. Especially useful if you are deciding when to claim Social Security, when to retire, or whether to convert traditional balances to Roth before RMDs begin.
Less relevant if you are under 40 (compounding still does most of the work), a defined-benefit pension covers more than 70% of your expected expenses, or you already have a fiduciary advisor running a full plan.
What you'll receive when you run the free analysis
About 5 minutes, no account required to see your numbers:
- Plan Confidence score — probability your portfolio survives a 30+ year retirement
- Year-by-year withdrawal & tax projection across hundreds of market scenarios
- Social Security claiming recommendation with break-even math for your earnings record
- Pre-Medicare healthcare bridge cost if retiring before 65
- Roth conversion windows ranked by tax-bracket impact
- Specific adjustments ranked by their impact on your Plan Confidence score
How this differs from a rule-of-thumb calculator is detailed in Section 6.
The Honest Benchmark: What "On Track" Actually Means
Most retirement rules of thumb give you a single number: save 10 times your salary. Or 15% of your income. Or follow the 4% rule. These are useful starting points, but they share the same flaw — they were designed for the average retiree at the average retirement age.
If you plan to retire at 62, you need more than 10×. If you have a pension or substantial Social Security income, you may need less. And if you are behind your age benchmark right now, the target savings rate is much higher than 15%.
The most commonly cited benchmarks come from three sources:
- Fidelity: 10× your final salary saved by age 67, and a 15% savings rate annually (including employer match).
- T. Rowe Price: An age-based sliding scale — 1× salary by 30, 3× by 40, 6× by 50, 8–10× by 60, and 10–14× by retirement, depending on when you plan to stop working.
- The Trinity Study (4% rule): At retirement, a portfolio of 25× your annual spending has historically survived 30 years in most market scenarios.
Two variables most rules ignore: healthcare costs before Medicare at 65 (retiring at 60 means a 5-year bridge with no employer coverage) and Social Security gap years (claiming at 62 permanently reduces your benefit by up to 30%).
Age-Specific Savings Multiples: Where Should You Be?
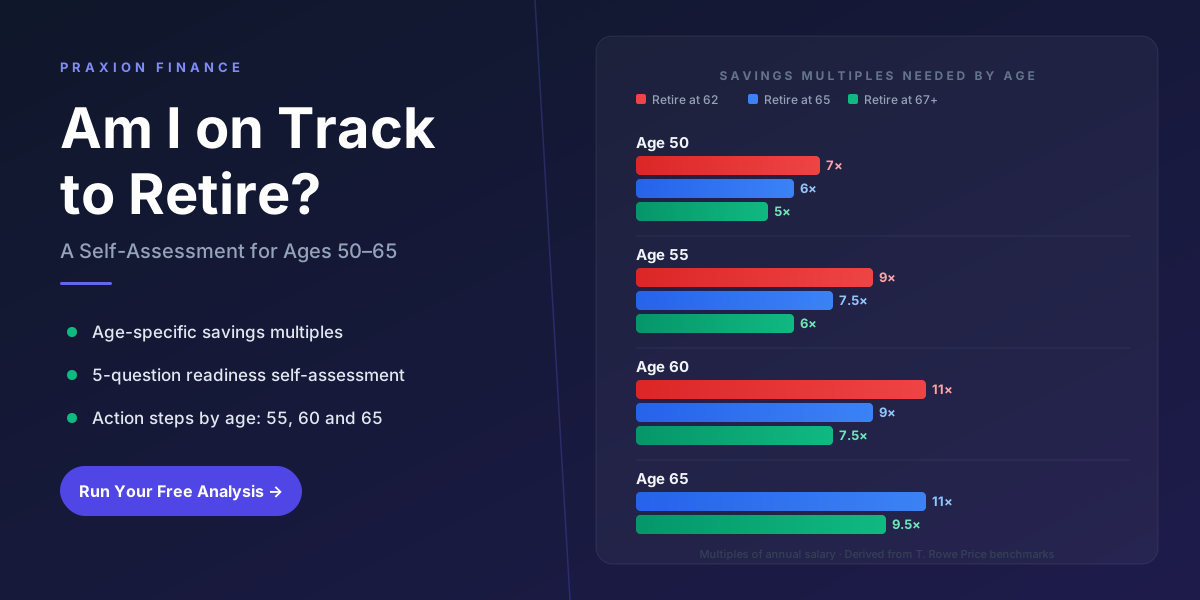
The table and chart below show how much you should have saved — expressed as a multiple of your current annual salary — based on your age and when you plan to retire. These are derived from T. Rowe Price's benchmark ranges, adjusted for different retirement ages.
| Your Age | Retiring at 62 | Retiring at 65 | Retiring at 67–70 |
|---|---|---|---|
| 50 | 7× | 6× | 5× |
| 55 | 9× | 7.5× | 6× |
| 60 | 11× | 9× | 7.5× |
| 65 | — | 11× | 9–10× |
Savings Multiple Benchmarks by Age and Retirement Age
How many times your annual salary you should have saved — by your current age and when you plan to retire
Earlier retirement requires more savings because your portfolio must last longer and your Social Security benefit is reduced. Age 65 / Retire at 62 is shown as N/A — you cannot plan to retire at 62 and only start saving at 65.
Methodology & sources
The savings multiples are derived from T. Rowe Price's published age-based benchmark ranges and adjusted upward for earlier-retirement scenarios using the longer required portfolio-survival window (30–35 years instead of 20–25). The cross-check is the Trinity Study 4% rule, which translates to a 25× annual-spending multiple at retirement. Fidelity's “10× by 67” benchmark sits within the same range for the median household.
What these multiples do not assume: defined-benefit pensions, inheritances, business-sale proceeds, or real-estate equity beyond a paid-off primary residence. If any of those apply to your household, your required savings multiple is materially lower than the table suggests — which is exactly the kind of cash-flow nuance a personalized plan (see Section 6) is built to capture.
A note on "salary"
If your income has changed significantly in the last few years, use your average income over the past 3 years rather than your peak year. For couples, benchmark against household income — then divide the result by 2 to get the per-person equivalent, or keep it as a household total.
Earlier retirement requires a higher multiple for two reasons: your portfolio must last longer (potentially 30–35 years instead of 20–25), and you have fewer Social Security credits — meaning a smaller monthly benefit for life.
The 5-Question Self-Assessment
These five questions map to the most common retirement planning risks. Answer honestly — the point is not to feel good or bad about where you stand, but to identify which areas need attention before it's too late to act.
On track: Within 10% of the target multiple for your age and retirement date. Watch closely: 10–25% below. Act now: More than 25% below — you are in catch-up territory.
Divide your expected annual retirement spending (before Social Security) by your total savings. If the answer is above 4%, your plan depends on strong market returns or lower spending. If retiring before 65, a safer target is 3.3–3.5% due to the longer time horizon.
Every year you delay claiming past 62 increases your benefit by 6–8% — up to age 70. Claiming at 62 vs 70 can mean a 77% difference in your monthly benefit for life. Most people have no explicit strategy and claim when they stop working — often the most expensive default.
Medicare begins at 65 — full stop. If you retire at 60, you need 5 years of private coverage. ACA marketplace plans for a 60-year-old with a $60,000 income run $600–$1,200/month before subsidies. Have you priced this and built the cost into your plan?
A major market decline in the first 3 years of retirement can permanently damage a portfolio because you are forced to sell assets at depressed prices to fund living expenses. A short-term cash buffer lets you wait out downturns without selling equities.
Scoring: 5 questions answered positively → strong position. 3–4 → moderate concern, identify and address the gaps. 1–2 → significant risk; prioritize a comprehensive review now.
Portfolio Survival Rate by Withdrawal Rate
Historical success rates based on Trinity Study and Vanguard research across rolling market periods since 1926
The 35-year horizon applies to early retirees (retiring at 60 or before). Past performance does not guarantee future results. A 90%+ survival rate is generally considered a safe planning target.
Want a personalized score — not just a self-assessment?
Praxion computes a Plan Confidence score from your actual savings, Social Security estimate, healthcare costs, and Monte Carlo stress tests — not just benchmarks. Run your free analysis.
Why You Might Be Further Behind Than You Think
Most people who feel "roughly on track" are looking at a nominal balance against a nominal benchmark. Four forces consistently erode retirement plans in ways that simple calculations miss:
1. Inflation quietly shrinks your real spending power
A $1 million portfolio today supports $40,000/year in real purchasing power. In 20 years at 3% inflation, that same $40,000/year withdrawal buys what $22,000 buys today. Plans that model nominal returns without inflation adjustments systematically overstate retirement income.
2. Healthcare costs are larger than most people plan for
Fidelity estimates that a 65-year-old couple retiring today needs approximately $315,000 set aside specifically for healthcare costs in retirement — separate from premiums Medicare doesn't cover. Long-term care costs are on top of that. Most plans treat healthcare as a fixed monthly number. The reality is a lumpy, escalating cost that peaks late in retirement when portfolio recoveries matter least.
3. Most people claim Social Security too early
The average American claims Social Security at 64. Every year before 70 that you claim is a permanent reduction. The chart below makes the dollar impact concrete:
Social Security Monthly Benefit by Claiming Age
Example based on $2,400/month full retirement age (FRA) benefit. Actual benefit varies by earnings history.
Delaying from 62 to 70 increases your monthly benefit by 77% — a difference worth over $70,000 in income by age 85, even after accounting for the years you didn't collect.
The break-even calculation
Delaying from 67 to 70 costs you 3 years of $2,400/month = $86,400 in foregone benefits. You make it back at approximately age 82–83 through higher monthly payments — and collect the higher amount for every year you live past that. For a couple optimizing both spouses' benefits, the lifetime gain is often $200,000+.
4. Sequence of returns risk is the silent portfolio killer
A 20% market decline in year 2 of retirement is categorically different from the same decline in year 15. Early losses force you to sell more shares at low prices, depleting the base that would otherwise compound during recovery. Historically, retiring into a bear market reduces safe withdrawal rates by 0.5–1.0 percentage points compared to retiring into a flat or rising market. Your long-term average return may look fine on paper while the sequence destroys the plan.
What to Do If You're Behind — By Age
The levers available to you depend heavily on your age. The actions with the highest return on effort shift as you approach retirement.
At 55 — you have time, but less than you think
| Action | Details (2026) | Impact |
|---|---|---|
| Max 401(k) catch-up | $23,500 standard + $7,500 catch-up = $31,000/year | High |
| Max IRA catch-up | $7,000 + $1,000 catch-up = $8,000/year (income limits apply) | High |
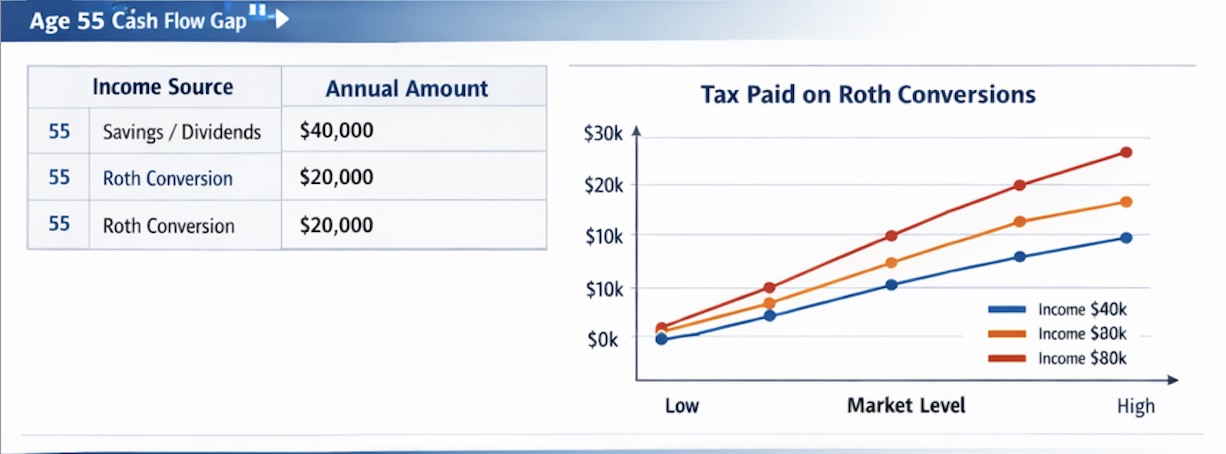
| Open Roth conversion window | Convert at 22–24% today vs. 32–37% RMD rates later | High |
| Model 2–3 extra working years | Adds contributions, delays withdrawals, grows SS credits simultaneously | Very High |
| Plan SS delay strategy | 15+ years until 70; delay adds 8%/year guaranteed | High |
At 60 — the sprint begins
- Stress-test with Monte Carlo: Rule-of-thumb targets become inadequate this close to retirement. Run a simulation across hundreds of market scenarios to understand the real probability of plan success — not just an average-return projection.
- Price the healthcare bridge: If you plan to retire before 65, calculate the actual cost of 5 years of private coverage for your household. It can run $30,000–$80,000 per year before ACA subsidies — a number that changes how much you need to save.
- Model part-time income: Earning $20,000–$30,000/year in the first 3–5 years of retirement dramatically reduces sequence-of-returns risk because you draw less from the portfolio during the vulnerability window.
- Lock in your Social Security claiming age: This decision is best made before you retire, not after — it determines how you structure your early withdrawal strategy. Use the Praxion Social Security Analyzer to find your break-even age.
At 65 — shift to income planning
- Restructure to income-first: A bucket strategy — cash (1–2 years), bonds (3–7 years), equities (8+ years) — lets you ride out market cycles without forced selling.
- Choose Medicare coverage carefully: The decision between Medicare Advantage and a Medigap supplement has a significant long-term cost difference. See our Medicare Advantage vs. Medigap guide.
- Plan RMD timing: Required minimum distributions begin at 73. If traditional 401(k) and IRA balances are large, RMDs can push you into a higher bracket and trigger Medicare IRMAA surcharges. Roth conversions before 73 reduce this exposure.
What a Real Plan Models (vs. a Rule of Thumb)
The savings multiples and withdrawal rules above are useful screening tools. They tell you whether you're in the right neighborhood. But they cannot answer the specific question that matters: will my specific plan hold up?
| What rules of thumb model | What a personalized plan models |
|---|---|
| Average salary multiple | Your actual savings, accounts, and balances |
| Average Social Security benefit | Your actual earnings record and optimal claiming age |
| Generic withdrawal rate | Monte Carlo survival rate across hundreds of market scenarios |
| No tax planning | Roth conversion windows, bracket management, RMD timing |
| No healthcare modeling | Bridge years, Medicare costs, long-term care risk |
| Single outcome | Plan Confidence score: probability your plan lasts your lifetime |
Praxion builds all of this into a single Plan Confidence score. You can run the analysis as a guest in under 5 minutes — no account required to see your numbers.
Common Questions
How much should I have saved by 60 to retire comfortably?
By 60, most benchmarks suggest 9–11× your annual salary if retiring at 62, or 8–9× if retiring at 67. The exact target depends on your expected Social Security benefit, planned spending, and whether you have healthcare coverage before 65. See the table and chart in Section 2 for the full breakdown.
What is the savings multiple rule of thumb for retirement?
The most widely cited milestones: 1× salary by 30, 3× by 40, 6× by 50, 8–10× by 60, and 10–12× by retirement. These assume retiring at 65–67. Earlier retirement requires meaningfully higher multiples because your money must last longer and your Social Security benefit is smaller.
Can I retire at 62 with $1 million saved?
$1 million supports roughly $40,000/year at the 4% withdrawal rate — before taxes. Combined with even a reduced Social Security benefit, many households can manage at 62 with careful budgeting. The bigger risks are healthcare costs from 62 to 65 and sequence-of-returns risk in the early years. A Monte Carlo simulation gives a more honest answer than any rule of thumb.
What happens if I'm behind at 55?
At 55, you have three high-impact levers: max catch-up contributions ($31,000/year in a 401(k) for 2026), delay Social Security to grow benefits 8%/year up to 70, and model 2–3 extra working years — each of which adds contributions, delays withdrawals, and increases Social Security credits simultaneously.
How do I know if my withdrawal rate is safe?
The 4% rule is calibrated for a 30-year retirement. If you retire before 65, a safer rate is 3.3–3.5%. The withdrawal rate chart in Section 3 shows historical survival rates across different horizons. Running a Monte Carlo simulation gives a more complete answer than any rule of thumb.
What is the biggest risk to a retirement plan?
Sequence of returns risk — a major market decline in the first 3–5 years of retirement — is consistently the largest threat. The buffer: hold 1–2 years of living expenses in cash or short-term bonds so you never have to sell equities into a downturn to fund daily expenses.
Is $500K enough to retire at 65?
At the 4% rule, $500K supports $20,000/year in withdrawals. Added to the average Social Security benefit (~$22,000–$24,000/year in 2026 for an average earner), total income approaches $42,000– $44,000/year. For a single person with low expenses, that's workable. For a couple with significant healthcare costs, it's tight. Delaying Social Security to 70 and maximizing your benefit changes this math materially.
How does Social Security affect whether I'm on track?
Social Security replaces roughly 40% of pre-retirement income for an average earner — which is why the savings multiples are 10×, not 25×. The claiming age matters enormously: every year you delay from 62 to 70 increases your benefit by 6–8%, for a total difference of 77%. Optimizing your claiming age is often the single highest-impact retirement planning decision.
Get Your Personalized Retirement Readiness Score
The benchmarks above tell you whether you're in the right neighborhood. A Praxion plan tells you exactly where you stand — modeling your Social Security estimate, Roth conversion windows, healthcare costs, and hundreds of market scenarios into one Plan Confidence score you can act on. No account required to start.
Note: This article was drafted with AI assistance and reviewed by the Praxion Finance editorial team. The savings multiples and benchmarks referenced are drawn from publicly available research by Fidelity Investments, T. Rowe Price, and the Trinity Study. They are illustrative targets, not personalized financial advice. Consult a qualified financial advisor before making retirement planning decisions.