Growing Wealth: Retirement Success Starts by Forecasting Portfolio Maturity
Know the modeled number. Understand the trajectory. Plan retirement with grounded confidence.

Why Most Retirement Calculators Get It Wrong
Traditional retirement calculators ask: "How much is needed?" But that is only half the question. The real question is: "Will the portfolio modeled here support the intended lifestyle?"
Praxion's Retirement Success Calculator does not only produce a target—it forecasts how the portfolio matures over time, models different growth scenarios, and shows whether the current modeled plan may succeed.
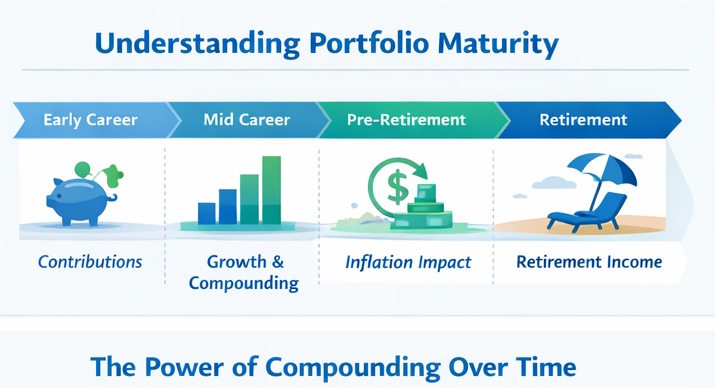
What Is Portfolio Maturity?
Portfolio maturity is the point where investments have grown enough to sustainably fund retirement lifestyle. It is not just about reaching a number—it is about understanding the trajectory of modeled wealth and whether the current strategy may reach that target.
Think of it like planting a tree. It is not enough to know how tall it should be—it is necessary to know if it is growing fast enough, if the soil is right, and if it may reach maturity before funds are needed from it.
Key Components of Portfolio Maturity:
- Time Horizon: How many years until retirement? More time means more compounding power.
- Contribution Rate: How much is saved annually. Small increases compound dramatically over decades.
- Growth Rate: Expected investment returns. Conservative estimates (6-7% for stocks) are safer than optimistic ones.
- Target Amount: The retirement number based on expected expenses, not generic rules of thumb.
- Success Probability: The likelihood the plan will succeed, accounting for market volatility.
Why a Single "Retirement Number" Alone Is Not Enough
Knowing $2 million is modeled as needed to retire is useful, but it is incomplete. What if the trajectory is only on track to reach $1.5 million? What if market returns are lower than expected? What if the goal is to retire earlier or spend more?
A static number doesn't account for:
- Market Volatility: Real returns aren't smooth. Some years returns may be +20%, others -10%.
- Sequence of Returns: Bad returns early in retirement can devastate a plan, even if average returns are good.
- Inflation: $2 million today might only buy what $1.2 million buys in 20 years.
- Life Changes: Job loss, medical expenses, or family needs can derail even strong plans.
- Uncertainty: There is no way to know exactly when retirement begins, how long life lasts, or what expenses will arise.
That is why the tool forecasts portfolio maturity across multiple scenarios, not just calculate a single number.
How this documentation differs from traditional retirement guides
This URL is the public documentation for Praxion's forecast-first calculator—it explains portfolio maturity, scenarios, success odds, and gaps so search engines and readers see why it is not interchangeable with a generic "multiply expenses by 25" blog post or a one-field nest-egg widget.
For deeper reading that complements (rather than duplicates) this page:
- Why retirement projections often look unrealistic— common modeling traps that make lump-sum targets misleading.
- Early warning signs in retirement plans— sequence-of-returns stress, spending phases, and when smooth-average math breaks down.
- Timing retirement alongside markets and cash flow— why trajectory and timing matter as much as a headline number.
The Praxion Approach: Forecast Before Committing
Most retirement calculators use simple math: "If $X is saved per year and returns average Y%, the balance at retirement may be $Z." This assumes everything goes perfectly—same returns every year, no surprises, no adjustments needed.
We do something different. Our calculator:
- Forecasts Portfolio Growth: Models how savings may grow over time, accounting for compounding and market cycles.
- Runs Multiple Scenarios: Shows conservative, expected, and optimistic outcomes so the range of possibilities is clear.
- Calculates Success Probability: Uses Monte Carlo simulation to show the likelihood the plan will succeed.
- Identifies Gaps Early: Highlights when the trajectory falls short and suggests specific actions to get back on track.
- Updates in Real-Time: As inputs change, outputs update immediately to show how changes affect the forecast.
This is not just a calculator—it is a forecasting engine that supports informed decisions about retirement strategy.
How Portfolio Growth Actually Works
Understanding compounding is crucial to retirement planning. The difference between starting early and starting late isn't just about time—it's about exponential growth.
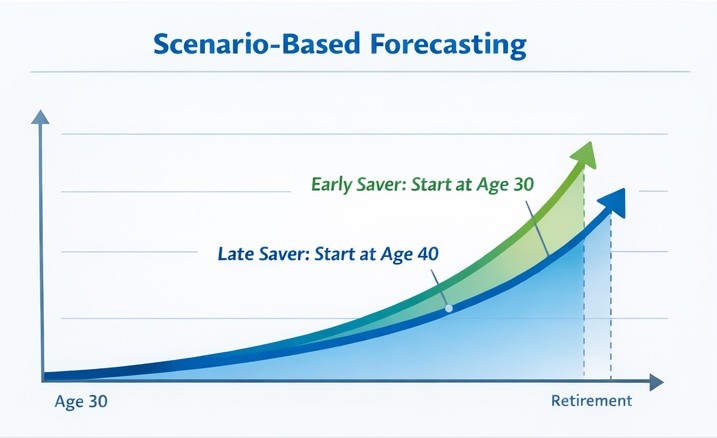
The Power of Starting Early
Consider two people saving for retirement:
- Early Saver: Saves $5,000/year from age 25 to 35 (10 years), then stops. Total contributed: $50,000.
- Late Saver: Starts at 35, saves $5,000/year until 65 (30 years). Total contributed: $150,000.
Who has more at 65? With a simplified constant 7% annual return on end-of-year contributions and no taxes or fees, the Early Saver ends near $563,000 while the Late Saver ends near$472,000. The early saver contributes $100,000 less in total yet finishes ahead because those dollars compound longer—even after contributions stop. Real markets are not this smooth; the point is structural, not a promise of exact balances.
This is why small increases in the savings rate today can have enormous impacts decades from now. Increasing annual contributions by just $1,000 can add $50,000-$100,000 to the retirement balance, depending on the time horizon.
Key Inputs That Shape Modeled Retirement Outcomes
The retirement forecast depends on several key factors. Understanding how each one affects outcomes supports better decisions:
1. Current Savings
What is already saved is the starting point. The larger the balance now, the less must be saved going forward. Do not despair if the trajectory started late—time and consistent contributions can still reach targets.
2. Annual Contributions
This is often the most powerful lever in the model. Increasing the savings rate by even 1-2% can dramatically improve the forecast. Consider:
- Maximizing employer 401(k) matches (free money!)
- Using catch-up contributions if age is 50+
- Automating increases each year
- Redirecting raises and bonuses to retirement savings
3. Investment Returns
Expected returns depend on asset allocation. Our calculator uses realistic assumptions:
- Stocks: 6-7% annual returns (after inflation)
- Bonds: 2-3% annual returns (after inflation)
- Balanced Portfolio: 5-6% depending on stock/bond mix
Be conservative here. Overestimating returns leads to false confidence and insufficient savings.
4. Retirement Age
Working longer allows more time to save and less time to spend. Delaying retirement by just 2-3 years can significantly improve the forecast because:
- Contributions continue for more years
- The portfolio compounds longer
- Withdrawals cover fewer years
- Social Security benefits increase (if claiming is delayed)
5. Retirement Expenses
The retirement number depends on how much will be spent. Many people underestimate expenses. Consider:
- Healthcare costs (often $5,000-$10,000/year beyond Medicare)
- Travel and hobbies (more free time in retirement)
- Home maintenance and property taxes
- Inflation (prices will be higher in the future)
Use our Can I Retire Calculator to get a detailed breakdown of expected expenses.
6. Other Income Sources
Social Security, pensions, and rental income reduce how much must be saved. Our calculator accounts for these automatically. Use our Social Security Analyzer to model claiming strategy.
Scenario-Based Forecasting: Why One Number Isn't Enough
The future is uncertain. Market returns vary, life happens, and plans change. That's why we forecast multiple scenarios so the range of possible outcomes is clear.
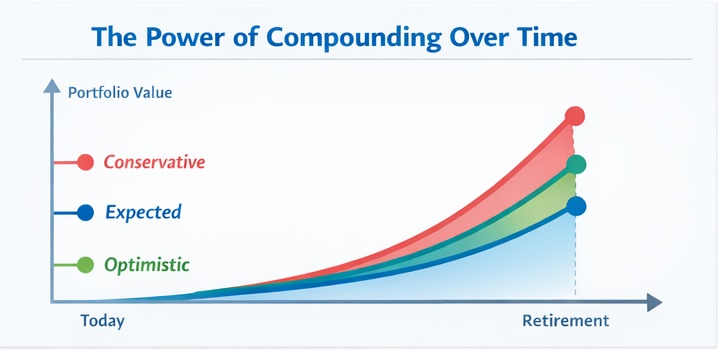
Conservative Scenario
Assumes lower returns (5-6% for stocks) and accounts for market downturns. If the plan works in this scenario, the trajectory is well-positioned. This is the "worst reasonable case."
Expected Scenario
Uses historical average returns (6-7% for stocks). This is what's most likely to happen based on past market performance. Most people should plan around this scenario.
Optimistic Scenario
Assumes above-average returns (7-8% for stocks). Do not rely on this alone, but it shows what is possible if markets perform well. Use this to see how much buffer might exist.
Why This Matters
A plan that only works in the optimistic scenario is risky. A plan that works in the conservative scenario is robust. Our calculator shows all three so risk tolerance and savings rate can be compared in context.
Want to see how the portfolio matures under different market conditions?
Use our Monte Carlo Simulator to run thousands of scenarios and see the probability distribution of outcomes. Or try our Historical Stress Test to see how the plan would have performed during past market crashes.
Forecast Portfolio Maturity →Measuring Retirement Success
Success is not just about reaching a number—it is about confidence the plan may work. Our calculator provides several metrics to assess progress:
1. Retirement Number
The total amount needed saved by retirement age. This is calculated based on expected expenses, life expectancy, and other income sources (Social Security, pensions).
2. Current Progress
What percentage of the goal is already saved. If the plan is 40% of the way there at age 40 with 25 years until retirement, the trajectory is roughly on track.
3. Projected Balance at Retirement
What the model projects at retirement if the current savings rate continues. Compare this to the retirement number to see if the trajectory is on track or falling short.
4. Success Probability
The likelihood the plan will succeed, accounting for market volatility. This uses Monte Carlo simulation to test thousands of possible market scenarios. Aim for 85-90% or higher.
5. Gap Analysis
If there is a gap between projected balance and retirement number, the calculator shows how much more must be saved annually to close it. This produces a concrete modeled action plan.
Understanding the Results
- On Track (Projected Balance ≥ Retirement Number): The trajectory looks solid. Consider increasing savings slightly to build a buffer.
- Close (Within 10-15%): Small adjustments—increasing savings by 1-2% or working 1-2 years longer—can close the gap.
- Behind (Gap > 15%): More significant changes needed. Consider maximizing contributions, delaying retirement, or adjusting expectations.
How to Improve Portfolio Maturity
If the forecast shows the trajectory falling short, do not panic. There are several proven strategies to improve the outlook:
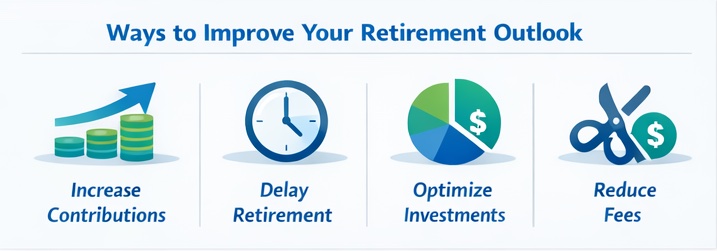
1. Increase Contributions
This is often the most powerful lever. Even small increases compound dramatically over time:
- Increase the 401(k) contribution by 1% each year
- Maximize employer matches (it's free money!)
- Use catch-up contributions if age is 50+ ($7,500 extra to 401k, $1,000 to IRA in 2024)
- Redirect raises and bonuses to retirement savings
- Automate increases so adjustments happen without manual tracking
2. Delay Retirement
Working 2-3 years longer can significantly improve the forecast:
- More time to save and compound
- Fewer years to fund in retirement
- Higher Social Security benefits (if claiming is delayed)
- Less sequence of returns risk (smaller portfolio needed)
3. Model Investments
Make sure the portfolio is positioned for growth:
- Use our Asset Allocation Analyzer to check whether allocation is too conservative or too aggressive
- Rebalance annually to maintain the target allocation
- Consider low-cost index funds to maximize returns
- Review and reduce investment fees (they eat into returns over time)
4. Reduce Fees
High fees can cost hundreds of thousands over a career. A 1% fee difference on a $1 million portfolio costs $10,000 per year. Over 30 years, that's $300,000+ in lost returns.
5. Model Taxes
Strategic tax planning may reduce taxes by tens of thousands in the model:
- Use our Tax Optimizer to model retirement taxes
- Consider Roth conversions in low-income years
- Harvest tax losses in taxable accounts
- Time withdrawals to stay in lower tax brackets
6. Adjust Expectations
Sometimes a strong approach is adjusting the modeled retirement lifestyle:
- Consider relocating to a lower-cost area
- Downsize housing to reduce expenses
- Plan for part-time work in early retirement
- Delay major expenses (travel, hobbies) until later in retirement
Small Changes, Big Impact
Do not underestimate the power of small, consistent improvements. Increasing savings by $200/month, reducing fees by 0.5%, and working 2 years longer can add $200,000-$300,000 to the retirement balance. That's the difference between struggling and thriving in retirement.
Why Praxion Is Different
Most retirement calculators give a number and stop there. We go further:
1. Forecast-First Approach
We do not only calculate—we forecast. Our models show how the portfolio may mature over time, accounting for market volatility, inflation, and life changes.
2. Scenario-Based Planning
Instead of one number, the outputs include multiple scenarios. See conservative, expected, and optimistic outcomes so the range of possibilities is clear and planning can follow.
3. Evidence-Based Confidence
We use Monte Carlo simulation to calculate success probabilities. The model shows the likelihood the plan may succeed instead of relying on guesswork.
4. Actionable Insights
When the trajectory falls short, the tool shows how much more to save, when to adjust, and what changes have the biggest modeled impact.
5. Integrated Planning
Our calculator connects with other tools—Monte Carlo simulation, tax planning, and Social Security analysis—so the analysis stays integrated, not just isolated calculations.
6. Real-Time Updates
As inputs change, outputs update immediately. No waiting, no confusion—just instant feedback to support better decisions.
Frequently Asked Questions
How accurate is the Retirement Success Calculator?
The calculator provides a modeled estimate based on entered inputs and stated assumptions. Actual results vary with markets, taxes, behavior, and life events. Treat outputs as planning ranges—especially success probabilities and scenario bands—not guarantees. Update inputs at least annually or after major changes.
What is portfolio maturity versus a retirement number?
A retirement number is often summarized as a lump-sum balance goal. Portfolio maturityemphasizes whether modeled savings, contributions, and returns can reach that kind of target on time—with visibility into trajectory, downside scenarios, and gaps—not only the endpoint figure.
How is this different from a basic retirement number calculator?
Many calculators stop after a single projection line. This workflow is built around forecasts across conservative, expected, and optimistic paths, probability-style success metrics where applicable, and gap prompts—so you see whether the plan is robust, not just what balance prints at retirement age.
What's a realistic retirement number for someone earning $100,000/year?
To maintain a similar lifestyle, the model might need $1.5-2.5 million saved, depending on Social Security benefits, pension income, and expected expenses. The specific number depends on retirement lifestyle, location, and other income sources. Use the calculator with specific numbers for a personalized target.
Should the retirement number include home equity?
Generally, no. The retirement number should be liquid investable assets. A home can provide additional security (downsizing, reverse mortgage) but should not be the primary retirement funding source. If a sale and downsize is planned, net proceeds can be included, but relying on it as the main retirement income is risky.
How does Social Security affect the retirement number?
Social Security reduces the amount that must be saved because it provides modeled fixed income. For example, if Social Security covers $30,000/year of expenses, less must be saved to cover the remainder. Our calculator accounts for Social Security automatically. Use our Social Security Analyzer to model claiming strategy.
What if retirement savings are behind schedule?
Do not panic. Options include: increasing the savings rate, taking advantage of catch-up contributions (age 50+), delaying retirement by a few years, or adjusting expected retirement lifestyle. Small changes now can make a big difference. The calculator shows how much more must be saved to close the gap.
How often should the retirement plan be updated?
Review the plan at least once a year, and whenever major life events occur (new job, inheritance, health changes, marriage, children). Market conditions, income changes, and life circumstances all affect the forecast. Regular updates help the plan stay on track.
What is a good success probability for the retirement plan?
Many financial planners suggest a success rate of 85-90% or higher. This means the plan succeeds in 85-90% of simulated scenarios, accounting for various market conditions. A 100% success rate might indicate assumptions are overly conservative, while below 75% suggests adjustments may be needed. Use our Monte Carlo Simulator to see the success probability.
Can I retire early with limited savings?
Early retirement is possible but may require adjustments to spending, income, or retirement age. The calculator shows what is modeled as needed. Common strategies include: maximizing savings in final working years, reducing expenses, planning for part-time work, or accepting a lower lifestyle. Use our Can I Retire Calculator for a detailed analysis.
See If the Retirement Plan Is Modeled to Work
Forecast how the portfolio matures over time, compare growth scenarios, and identify gaps before it is too late. Get clarity in under 30 seconds.
No credit card · No commitment · Private & secure